
 Yahoo News
 American Rare Earths Limited's (ASX:ARR) Stock Has Seen Strong Momentum: Does That Call For Deeper Study Of Its Financial Prospects?

American Rare Earths' (ASX:ARR) stock is up by a considerable 170% over the past three months. As most would know, fundamentals are what usually guide market price movements over the long-term, so we decided to look at the company's key financial indicators today to determine if they have any role to play in the recent price movement. Specifically, we decided to study American Rare Earths' ROE in this article.
Return on equity or ROE is an important factor to be considered by a shareholder because it tells them how effectively their capital is being reinvested. Put another way, it reveals the company's success at turning shareholder investments into profits.
Check out our latest analysis for American Rare Earths
How Do You Calculate Return On Equity?
ROE can be calculated by using the formula:
Return on Equity = Net Profit (from continuing operations) ÷ Shareholders' Equity
So, based on the above formula, the ROE for American Rare Earths is:
15% = AU$923k ÷ AU$6.3m (Based on the trailing twelve months to June 2020).
The 'return' refers to a company's earnings over the last year. One way to conceptualize this is that for each A$1 of shareholders' capital it has, the company made A$0.15 in profit.
What Has ROE Got To Do With Earnings Growth?
So far, we've learned that ROE is a measure of a company's profitability. Depending on how much of these profits the company reinvests or "retains", and how effectively it does so, we are then able to assess a company’s earnings growth potential. Generally speaking, other things being equal, firms with a high return on equity and profit retention, have a higher growth rate than firms that don’t share these attributes.
American Rare Earths' Earnings Growth And 15% ROE
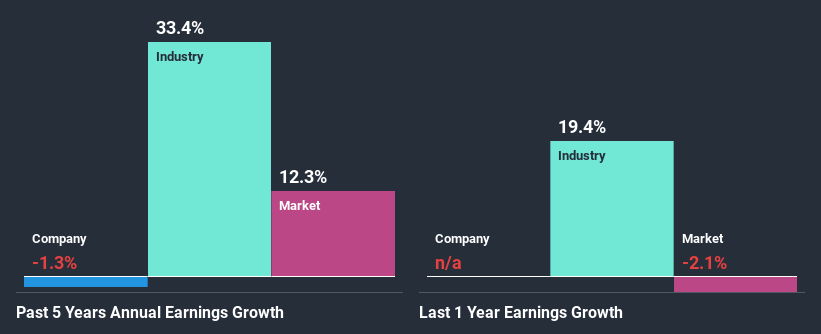
At first glance, American Rare Earths seems to have a decent ROE. And on comparing with the industry, we found that the the average industry ROE is similar at 13%. Despite this, American Rare Earths' five year net income growth was quite flat over the past five years. So, there could be some other aspects that could potentially be preventing the company from growing. For example, it could be that the company has a high payout ratio or the business has allocated capital poorly, for instance.
Next, on comparing with the industry net income growth, we found that the industry grew its earnings by33% in the same period.
The basis for attaching value to a company is, to a great extent, tied to its earnings growth. What investors need to determine next is if the expected earnings growth, or the lack of it, is already built into the share price. By doing so, they will have an idea if the stock is headed into clear blue waters or if swampy waters await. One good indicator of expected earnings growth is the P/E ratio which determines the price the market is willing to pay for a stock based on its earnings prospects. So, you may want to check if American Rare Earths is trading on a high P/E or a low P/E, relative to its industry.
Is American Rare Earths Using Its Retained Earnings Effectively?
American Rare Earths doesn't pay any dividend, meaning that the company is keeping all of its profits, which makes us wonder why it is retaining its earnings if it can't use them to grow its business. So there might be other factors at play here which could potentially be hampering growth. For example, the business has faced some headwinds.
Conclusion
Overall, we feel that American Rare Earths certainly does have some positive factors to consider. Although, we are disappointed to see a lack of growth in earnings even in spite of a high ROE and and a high reinvestment rate. We believe that there might be some outside factors that could be having a negative impact on the business. Until now, we have only just grazed the surface of the company's past performance by looking at the company's fundamentals. You can do your own research on American Rare Earths and see how it has performed in the past by looking at this FREE detailed graph of past earnings, revenue and cash flows.
This article by Simply Wall St is general in nature. It does not constitute a recommendation to buy or sell any stock, and does not take account of your objectives, or your financial situation. We aim to bring you long-term focused analysis driven by fundamental data. Note that our analysis may not factor in the latest price-sensitive company announcements or qualitative material. Simply Wall St has no position in any stocks mentioned.
Have feedback on this article? Concerned about the content? Get in touch with us directly. Alternatively, email editorial-team@simplywallst.com.

