
 Yahoo News
 Is AstraZeneca PLC's (LON:AZN) Balance Sheet A Threat To Its Future?

Want to participate in a research study? Help shape the future of investing tools and earn a $60 gift card!
There are a number of reasons that attract investors towards large-cap companies such as AstraZeneca PLC (LON:AZN), with a market cap of UK£81b. One reason being its ‘too big to fail’ aura which gives it the appearance of a strong and stable investment. However, the key to their continued success lies in its financial health. Today we will look at AstraZeneca’s financial liquidity and debt levels, which are strong indicators for whether the company can weather economic downturns or fund strategic acquisitions for future growth. Note that this information is centred entirely on financial health and is a high-level overview, so I encourage you to look further into AZN here.
Check out our latest analysis for AstraZeneca
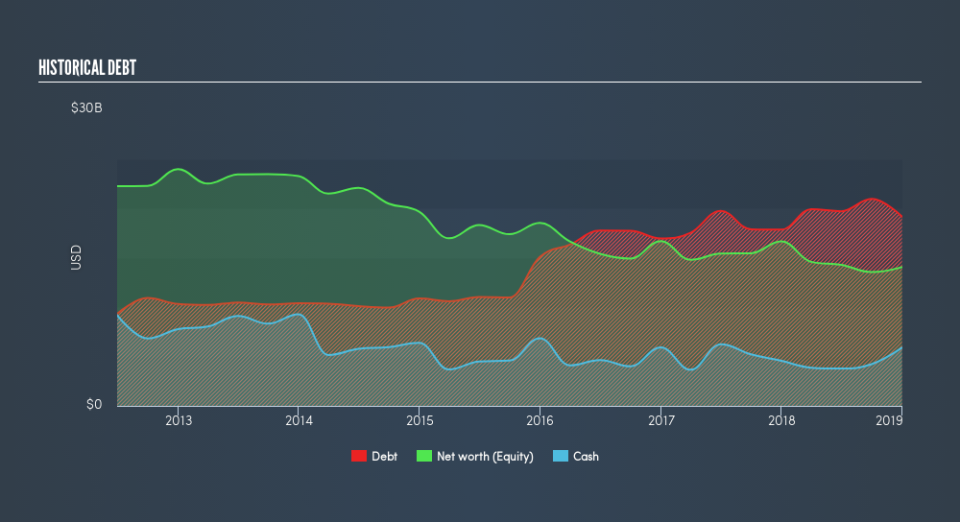
Does AZN Produce Much Cash Relative To Its Debt?
AZN has built up its total debt levels in the last twelve months, from US$18b to US$19b , which accounts for long term debt. With this increase in debt, AZN's cash and short-term investments stands at US$5.9b to keep the business going. On top of this, AZN has produced US$2.6b in operating cash flow over the same time period, resulting in an operating cash to total debt ratio of 14%, meaning that AZN’s current level of operating cash is not high enough to cover debt.
Can AZN meet its short-term obligations with the cash in hand?
At the current liabilities level of US$16b, it appears that the company may not be able to easily meet these obligations given the level of current assets of US$16b, with a current ratio of 0.96x. The current ratio is the number you get when you divide current assets by current liabilities.
Is AZN’s debt level acceptable?
AstraZeneca is a highly levered company given that total debt exceeds equity. This is not unusual for large-caps since debt tends to be less expensive than equity because interest payments are tax deductible. Consequently, larger-cap organisations tend to enjoy lower cost of capital as a result of easily attained financing, providing an advantage over smaller companies. We can check to see whether AZN is able to meet its debt obligations by looking at the net interest coverage ratio. A company generating earnings after interest and tax at least three times its net interest payments is considered financially sound. For AZN, the ratio of 2.86x suggests that interest is not strongly covered. The sheer size of AstraZeneca means it is unlikely to default or announce bankruptcy anytime soon. However, lenders may be more reluctant to lend out more funding as AZN’s low interest coverage already puts the company in a risky position.
Next Steps:
AZN’s high debt levels is not met with high cash flow coverage. This leaves room for improvement in terms of debt management and operational efficiency. In addition to this, its low liquidity raises concerns over whether current asset management practices are properly implemented for the large-cap. I admit this is a fairly basic analysis for AZN's financial health. Other important fundamentals need to be considered alongside. I recommend you continue to research AstraZeneca to get a more holistic view of the stock by looking at:
Future Outlook: What are well-informed industry analysts predicting for AZN’s future growth? Take a look at our free research report of analyst consensus for AZN’s outlook.
Valuation: What is AZN worth today? Is the stock undervalued, even when its growth outlook is factored into its intrinsic value? The intrinsic value infographic in our free research report helps visualize whether AZN is currently mispriced by the market.
Other High-Performing Stocks: Are there other stocks that provide better prospects with proven track records? Explore our free list of these great stocks here.
We aim to bring you long-term focused research analysis driven by fundamental data. Note that our analysis may not factor in the latest price-sensitive company announcements or qualitative material.
If you spot an error that warrants correction, please contact the editor at editorial-team@simplywallst.com. This article by Simply Wall St is general in nature. It does not constitute a recommendation to buy or sell any stock, and does not take account of your objectives, or your financial situation. Simply Wall St has no position in the stocks mentioned. Thank you for reading.

