
 Yahoo News
 Should Casablanca Group Limited’s (HKG:2223) Weak Investment Returns Worry You?

Today we are going to look at Casablanca Group Limited (HKG:2223) to see whether it might be an attractive investment prospect. In particular, we'll consider its Return On Capital Employed (ROCE), as that can give us insight into how profitably the company is able to employ capital in its business.
First up, we'll look at what ROCE is and how we calculate it. Then we'll compare its ROCE to similar companies. And finally, we'll look at how its current liabilities are impacting its ROCE.
What is Return On Capital Employed (ROCE)?
ROCE is a metric for evaluating how much pre-tax income (in percentage terms) a company earns on the capital invested in its business. In general, businesses with a higher ROCE are usually better quality. Overall, it is a valuable metric that has its flaws. Renowned investment researcher Michael Mauboussin has suggested that a high ROCE can indicate that 'one dollar invested in the company generates value of more than one dollar'.
So, How Do We Calculate ROCE?
The formula for calculating the return on capital employed is:
Return on Capital Employed = Earnings Before Interest and Tax (EBIT) ÷ (Total Assets - Current Liabilities)
Or for Casablanca Group:
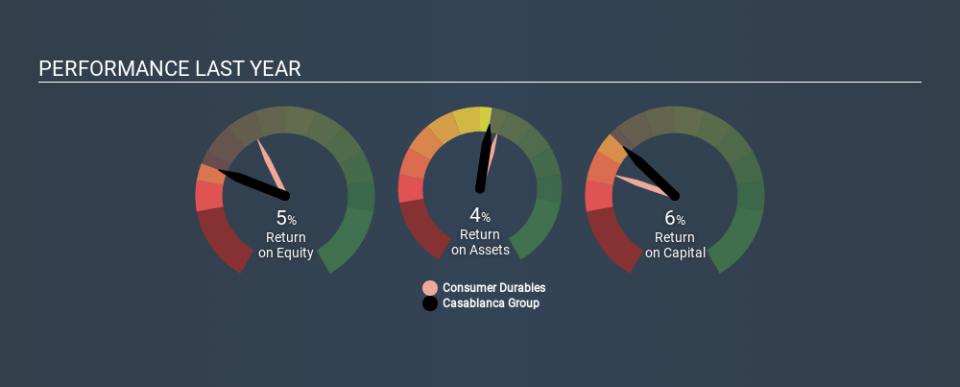
0.064 = HK$27m ÷ (HK$516m - HK$91m) (Based on the trailing twelve months to June 2019.)
So, Casablanca Group has an ROCE of 6.4%.
Check out our latest analysis for Casablanca Group
Is Casablanca Group's ROCE Good?
One way to assess ROCE is to compare similar companies. In this analysis, Casablanca Group's ROCE appears meaningfully below the 10% average reported by the Consumer Durables industry. This could be seen as a negative, as it suggests some competitors may be employing their capital more efficiently. Separate from how Casablanca Group stacks up against its industry, its ROCE in absolute terms is mediocre; relative to the returns on government bonds. It is possible that there are more rewarding investments out there.
We can see that, Casablanca Group currently has an ROCE of 6.4% compared to its ROCE 3 years ago, which was 3.5%. This makes us think the business might be improving. You can click on the image below to see (in greater detail) how Casablanca Group's past growth compares to other companies.
Remember that this metric is backwards looking - it shows what has happened in the past, and does not accurately predict the future. ROCE can be misleading for companies in cyclical industries, with returns looking impressive during the boom times, but very weak during the busts. ROCE is, after all, simply a snap shot of a single year. How cyclical is Casablanca Group? You can see for yourself by looking at this free graph of past earnings, revenue and cash flow.
How Casablanca Group's Current Liabilities Impact Its ROCE
Current liabilities are short term bills and invoices that need to be paid in 12 months or less. Due to the way the ROCE equation works, having large bills due in the near term can make it look as though a company has less capital employed, and thus a higher ROCE than usual. To check the impact of this, we calculate if a company has high current liabilities relative to its total assets.
Casablanca Group has total assets of HK$516m and current liabilities of HK$91m. As a result, its current liabilities are equal to approximately 18% of its total assets. It is good to see a restrained amount of current liabilities, as this limits the effect on ROCE.
Our Take On Casablanca Group's ROCE
With that in mind, we're not overly impressed with Casablanca Group's ROCE, so it may not be the most appealing prospect. Of course, you might also be able to find a better stock than Casablanca Group. So you may wish to see this free collection of other companies that have grown earnings strongly.
If you like to buy stocks alongside management, then you might just love this free list of companies. (Hint: insiders have been buying them).
If you spot an error that warrants correction, please contact the editor at editorial-team@simplywallst.com. This article by Simply Wall St is general in nature. It does not constitute a recommendation to buy or sell any stock, and does not take account of your objectives, or your financial situation. Simply Wall St has no position in the stocks mentioned.
We aim to bring you long-term focused research analysis driven by fundamental data. Note that our analysis may not factor in the latest price-sensitive company announcements or qualitative material. Thank you for reading.

