
 Yahoo News
 Do Directors Own Aurinia Pharmaceuticals Inc. (TSE:AUP) Shares?

Every investor in Aurinia Pharmaceuticals Inc. (TSE:AUP) should be aware of the most powerful shareholder groups. Institutions will often hold stock in bigger companies, and we expect to see insiders owning a noticeable percentage of the smaller ones. Warren Buffett said that he likes 'a business with enduring competitive advantages that is run by able and owner-oriented people'. So it's nice to see some insider ownership, because it may suggest that management is owner-oriented.
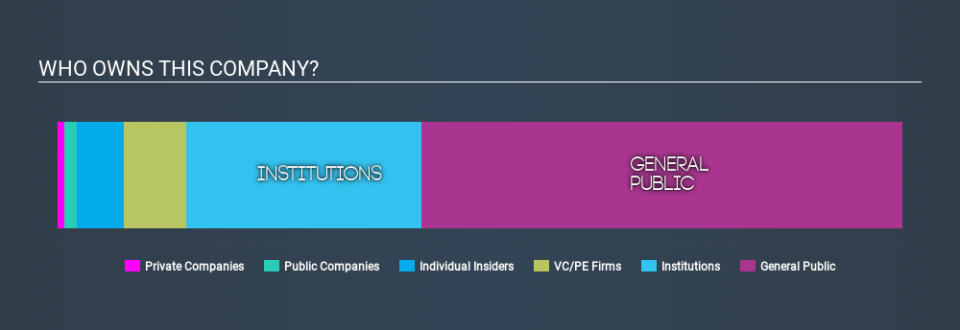
Aurinia Pharmaceuticals has a market capitalization of CA$2.8b, so we would expect some institutional investors to have noticed the stock. In the chart below, we can see that institutional investors have bought into the company. We can zoom in on the different ownership groups, to learn more about AUP.
See our latest analysis for Aurinia Pharmaceuticals
What Does The Institutional Ownership Tell Us About Aurinia Pharmaceuticals?
Institutional investors commonly compare their own returns to the returns of a commonly followed index. So they generally do consider buying larger companies that are included in the relevant benchmark index.
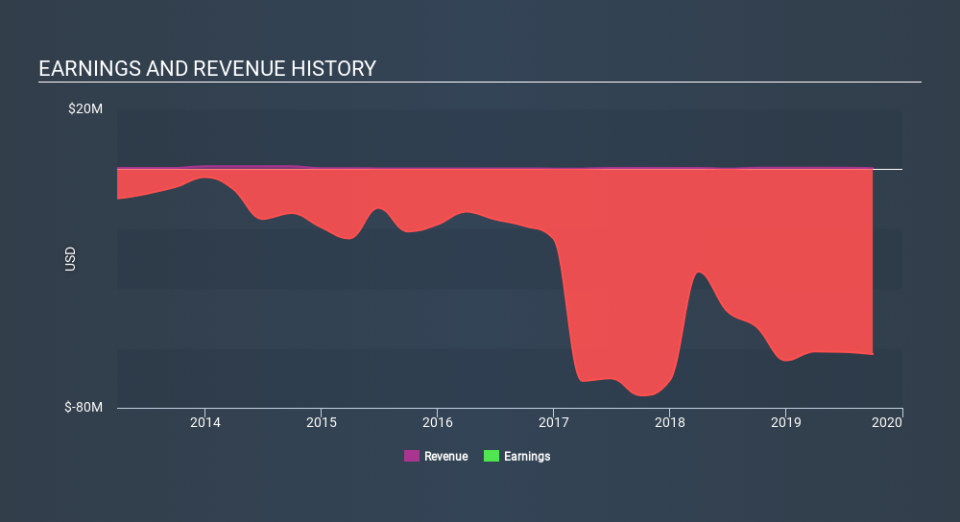
As you can see, institutional investors own 28% of Aurinia Pharmaceuticals. This suggests some credibility amongst professional investors. But we can't rely on that fact alone, since institutions make bad investments sometimes, just like everyone does. When multiple institutions own a stock, there's always a risk that they are in a 'crowded trade'. When such a trade goes wrong, multiple parties may compete to sell stock fast. This risk is higher in a company without a history of growth. You can see Aurinia Pharmaceuticals's historic earnings and revenue, below, but keep in mind there's always more to the story.
Hedge funds don't have many shares in Aurinia Pharmaceuticals. Quite a few analysts cover the stock, so you could look into forecast growth quite easily.
Insider Ownership Of Aurinia Pharmaceuticals
The definition of company insiders can be subjective, and does vary between jurisdictions. Our data reflects individual insiders, capturing board members at the very least. Company management run the business, but the CEO will answer to the board, even if he or she is a member of it.
Insider ownership is positive when it signals leadership are thinking like the true owners of the company. However, high insider ownership can also give immense power to a small group within the company. This can be negative in some circumstances.
Shareholders would probably be interested to learn that insiders own shares in Aurinia Pharmaceuticals Inc.. It is a pretty big company, so it is generally a positive to see some potentially meaningful alignment. In this case, they own around CA$152m worth of shares (at current prices). Most would say this shows alignment of interests between shareholders and the board. Still, it might be worth checking if those insiders have been selling.
General Public Ownership
The general public -- mostly retail investors -- own 57% of Aurinia Pharmaceuticals. This level of ownership gives retail investors the power to sway key policy decisions such as board composition, executive compensation, and the dividend payout ratio.
Private Equity Ownership
With an ownership of 7.3%, private equity firms are in a position to play a role in shaping corporate strategy with a focus on value creation. Some investors might be encouraged by this, since private equity are sometimes able to encourage strategies that help the market see the value in the company. Alternatively, those holders might be exiting the investment after taking it public.
Next Steps:
While it is well worth considering the different groups that own a company, there are other factors that are even more important.
Many find it useful to take an in depth look at how a company has performed in the past. You can access this detailed graph of past earnings, revenue and cash flow.
Ultimately the future is most important. You can access this free report on analyst forecasts for the company.
NB: Figures in this article are calculated using data from the last twelve months, which refer to the 12-month period ending on the last date of the month the financial statement is dated. This may not be consistent with full year annual report figures.
If you spot an error that warrants correction, please contact the editor at editorial-team@simplywallst.com. This article by Simply Wall St is general in nature. It does not constitute a recommendation to buy or sell any stock, and does not take account of your objectives, or your financial situation. Simply Wall St has no position in the stocks mentioned.
We aim to bring you long-term focused research analysis driven by fundamental data. Note that our analysis may not factor in the latest price-sensitive company announcements or qualitative material. Thank you for reading.
