
 Yahoo News
 Conditions that led to 2011 riots still exist today, experts warn
The conditions that led to riots across England 10 years ago still exist today, experts have warned, as data analysis showed significant cuts to youth services in affected areas and an increase in racial disparity in stop and search.
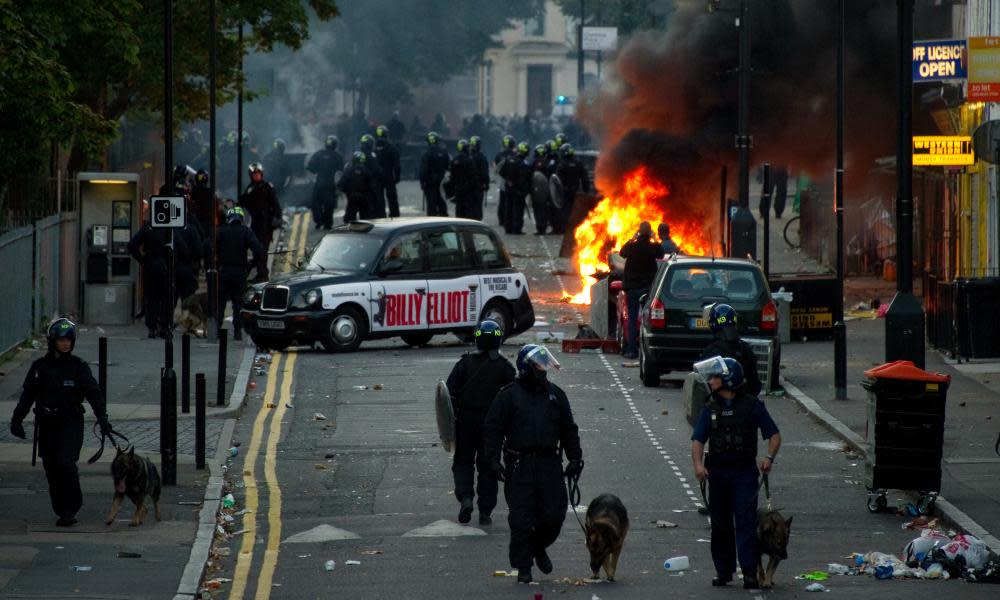
On 4 August 2011, police officers shot and killed Mark Duggan, a 29-year-old mixed-race man, in Tottenham, north London. His death sparked a wave of civil unrest that started the capital and spread to other cities, causing property damage to the value of £40m a day.
The Guardian analysed data around youth services, stop and search and deprivation in the areas most affected to see how things have changed since then. The analysis centres on the five areas where 49% of crimes took place – Haringey, Croydon, Southwark, Birmingham and Manchester.
Council services for young people have been cut significantly since 2010-11, at the beginning of the coalition government’s austerity programme, according to data analysed by YMCA England & Wales and shared exclusively with the Guardian.
Between then and 2019-20, the national budget for youth services was cut by £372m when adjusted for inflation, down 73%. Some of the areas affected by the riots have experienced even steeper cuts. In Haringey, where the riots originated, the youth services budget fell from £5.6m to just £970,000 – a cut of 85% when taking inflation into account.
Aika Stephenson, the legal director of the youth advocacy charity Just for Kids Law, said the cuts to social services had been “unrelenting”, affecting “almost every aspect that directly affects young people so, if anything, the situation is worse”.
Of the five areas analysed, Southwark lost 82% of its youth budget over this period, Birmingham’s decreased by 80% and Croydon lost 79%. Manchester’s decrease was in line with the national average.
The Guardian’s groundbreaking contemporary Reading the Riots project interviewed 270 people who were involved in the 2011 disturbances. Of those, 85% said policing was an important contributory factor. Nearly three-quarters of interviewees said they had been stopped and searched in the previous 12 months.
Ten years on, the most recent figures show that while stop and search numbers have declined overall, black people are still far more likely to be targeted by police than white people.
In the aftermath of the riots, Theresa May, then the home secretary, announced a national review of stop and search and the use of the tactic by police in England and Wales fell significantly.
However, in recent years that figure has been rising again and the government announced this week that it was considering permanently relaxing restrictions on section 60, which does not require a police officer to have a reasonable suspicion of crime before searching someone.
A Home Office spokesperson defended this position: “Every weapon seized is a potential life saved. Stop and search helped remove 11,000 dangerous weapons last year – including knives, machetes, and firearms.”
Racial disproportionality in the system has grown since 2010-11, according to data collated by Stopwatch, an organisation that monitors police powers.
In 2010-11, police in England and Wales stopped and searched 115 out of every 1,000 black people, compared with 17 per 1,000 white people – meaning black people were 6.7 times more likely to be targeted. But in 2019-20, black people were 8.9 times more likely to be searched than white people.
A Stopwatch spokesperson said: “It is not a coincidence that black people have the lowest level of confidence in the police of all ethnicities, with almost half of black Caribbeans surveyed unable to place their trust in their local force. A decade on, the evidence suggests that few lessons – if any – have been learned.”
A 2015 paper found that the rioters “were most likely to come from economically disadvantaged neighbourhoods”, yet many of the areas most affected by the 2011 riots remain among the country’s most deprived, according to Guardian analysis.
Low-level deprivation data shows that 74% of people living in Manchester in 2010 lived in the country’s poorest three deciles. That was consistent with the 76% living in the most deprived areas in 2019, including areas that experienced rioting in 2011 such as Cheetham Hill, Harpurhey, Blackley and Gorton.
A similar picture emerges in Birmingham: two-thirds of residents lived in areas among the country’s most deprived in 2010: that rose slightly to 69% in 2019. In Croydon, 34% of people lived in one of the country’s most-deprived areas in 2010, a figure that has since risen to 36%.
In Haringey and Southwark, both of which have undergone rapid gentrification in the past decade, the proportion of those living among the country’s most deprived areas fell significantly in the intervening years (73% to 54% in Haringey and 68% to 50% in Southwark).
However, Tottenham, in the borough of Haringey, still contains several areas among the most deprived 10% nationally, including Northumberland Park and White Hart Lane, in stark contrast to the richer areas in the south and west of the borough.
In Southwark, parts of Camberwell and Peckham where there was rioting in 2011 are still among the country’s poorest.
Andrew Neilson, the director of campaigns at the Howard League for Penal Reform, said: “Looking back on something like the riots after 10 years, one of the questions that you naturally think about is: will this happen again? And – not to be a scaremonger or anything like that – my answer to that question would be: very much so, yes, I could see it happening again.
“Local government [doesn’t] have the money that it had before. And in the end it is supporting communities locally which is the best way of avoiding the source of conditions that see riots.”

