
 Yahoo News
 Why you're probably confused about the real number of coronavirus cases in your area
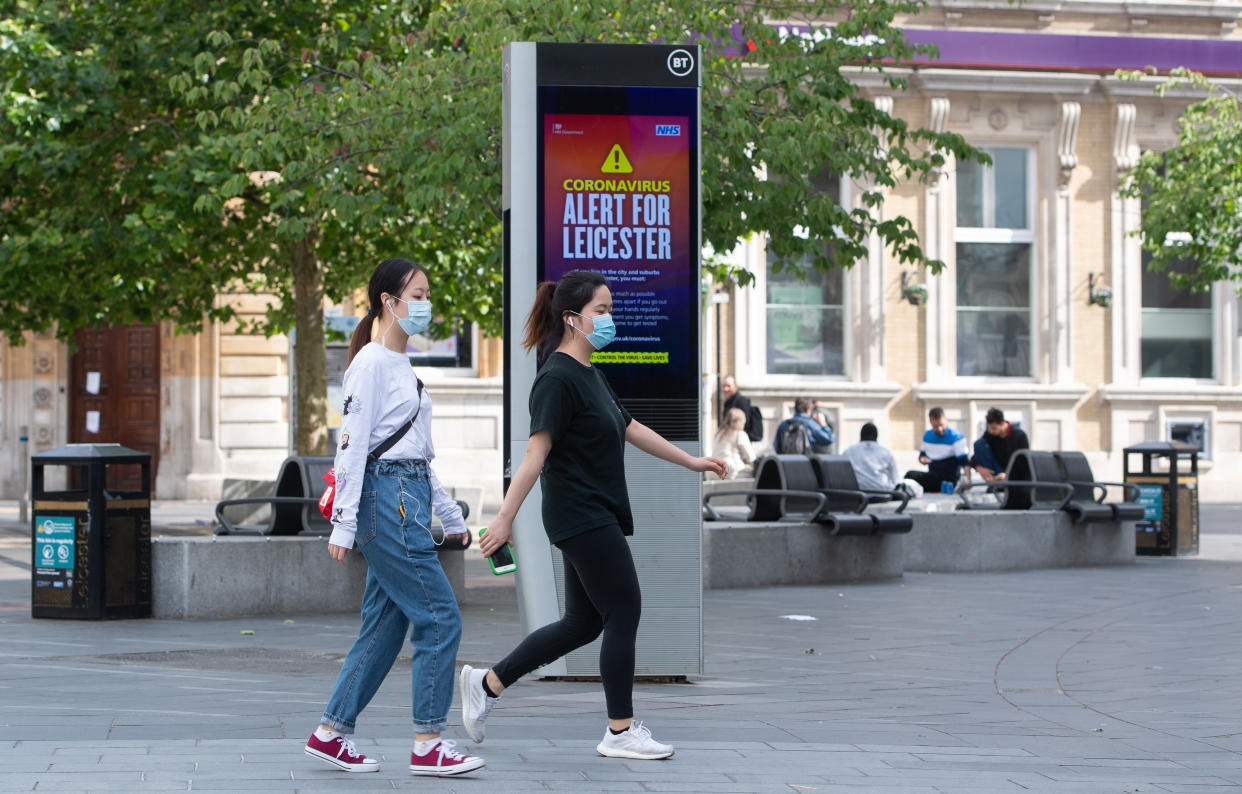

When Matt Hancock imposed a “local lockdown” on Leicester on Monday after a spike in coronavirus cases, it would have come as a shock to anyone who had been following the government’s official data on new infections in the city.
The government’s testing figures – the only daily local data publicly available – had said there were only 80 positive tests in the previous fortnight.
However, it transpired the actual number of infections was nearly 12 times this amount: 944.
It’s because a second – and more extensive – data set was not made public until it was announced by Leicester City Council on Monday.
With lockdown restrictions set to be eased in England on Saturday, this has problematic implications.
A lack of accurate data means people in towns and cities across the country will not know about local outbreaks – and that the nasty surprise of a Leicester-style lockdown could be just around the corner.
Here, Yahoo News UK explains the discrepancies surrounding coronavirus infection figures, and why this could be an issue as the nation attempts to come out of lockdown.
Pillars
As Boris Johnson and Sir Keir Starmer clashed over the Leicester lockdown at Prime Minister’s Questions (PMQs) on Wednesday, there was a lot of talk about “pillars”. Here’s why.
The discrepancies in Leicester’s infection rates can be explained through two data sets: pillar 1 and pillar 2.
Pillar 1 data is publicly available through the government’s coronavirus data service. It’s based on positive tests of NHS and care workers, as well as patients in hospitals. This accounted for the 80 infections mentioned above.
Pillar 2 is based on testing in the wider community, meaning the numbers of infections are likely to be higher. However, it is not publicly available, despite accounting for the vast majority of Leicester’s 944 infections.
The problem with this? “It’s a mismatch,” Dr Duncan Robertson, lecturer in management sciences at Loughborough University, tells Yahoo News UK.
“It [the pillar 1 figures showing 80 infections] makes it look as though Leicester doesn’t really have a problem, whereas if you look at all the tests [944], you can see that it does.”
So, who does get the pillar 2 data?
Pillar 2 data is currently only available to directors of public health at local councils who have signed a data protection agreement, health secretary Hancock told MPs on Monday.
However, Leicester City Council reported difficulties acquiring these figures. Mayor Sir Peter Soulsby said he had been trying “for weeks” to access the data, but that the town hall only got hold of this on Thursday last week.

With Hancock having confirmed on 18 June there was an outbreak in Leicester, Labour leader Starmer said this was a “lost week” while the virus was spreading across the East Midlands city.
What are the arguments for pillar 2 data being made public?
While Dr Robertson says local directors of public health should get information first in order to identify outbreaks at street or building level, he argues the public also needs access to timely data “at a town level”.
He says access to the latest local information will create “confidence in the measures that are being placed on people.
“If people don’t have confidence in the data, there’s likely to be less compliance with the measures that are taking place.”
He adds: “There’s no real downside to releasing data unless it gets down to real privacy-type levels where you are identifying individual people.”
What do we definitely know?
Public Health England has published a list of local authority cases from pillars 1 and 2, but it’s still only for the week ending 21 June – more than 10 days ago.
The top 10 councils with the most cases per 100,000 people were: Leicester (140.2), Bradford (69.4), Barnsley (54.7), Rochdale (53.6), Bedford (42.0), Oldham (38.6), Rotherham (33.6), Tameside (33.3), Blackburn with Darwen (32.9) and Kirklees (30.3).
On Wednesday, meanwhile, one authority – Greater Manchester – took it upon itself to publish its own up-to-date figures for its 10 areas in response to the situation in Leicester. It said Leicester’s seven-day infection rate per 100,000 was 135, as of Tuesday, compared to Greater Manchester’s 13.3.
Does the government plan to make pillar 2 data public?
Yes. After announcing the Leicester lockdown on Monday, Hancock promised MPs: “I am committing to the House to publish it at as local a level as possible, so that everybody will be able to see and analyse that data.”
However, he made no indication as to when this will be.
Who has spoken out against the government?
Starmer went on the attack at PMQs, citing an 11-day delay “during which the virus was spreading in Leicester”.
He told Boris Johnson: “There are now real fears of further local lockdowns across the country.”
The PM insisted the government has shared accurate COVID-19 infection data with councils across the country.
This prompted Labour frontbencher Jess Phillips to call Johnson “a liar”. “It has been incredibly hard for local authorities to get data and information from the beginning of the crisis,” she said.
In the medical world, the British Medical Association (BMA) has also called for “rapid data transparency” for dealing with local outbreaks.
Its council chair, Dr Chaand Nagpaul, said on Wednesday: “The PM has talked about a ‘whack-a-mole’ strategy to tackle local outbreaks, but this is no use if the people leading the response on the ground – be they public health teams or local leaders – are not given the most accurate up-to-date data possible.
“This is crucial to allow swift action and to protect lives and the health service, and something that is not happening right now.”
Coronavirus: what happened today
Click here to sign up to the latest news, advice and information with our daily Catch-up newsletter
Read more about COVID-19
How to get a coronavirus test if you have symptoms
How easing of lockdown rules affects you
In pictures: How UK school classrooms could look in new normal
How public transport could look after lockdown
How our public spaces will change in the future
Help and advice
Read the full list of official FAQs here
10 tips from the NHS to help deal with anxiety
What to do if you think you have symptoms
How to get help if you've been furloughed

