
 Yahoo News
 Crude Oil Price Update – Decision Time for Buyers at $39.42 to $38.83
U.S. West Texas Intermediate crude oil futures closed lower on Wednesday after the release of a mixed but disappointing government inventories report. Prices were also weighed down by concerns over lower demand due to the resurgence in COVID-19 cases and worries about a supply glut. Losses may have been limited, however, by hopes of a fresh fiscal stimulus deal in the United States.
On Wednesday, December WTI crude oil futures settled at $40.03, down $1.67 or -4.00%.
The U.S. Energy Information Administration (EIA) reported Wednesday that crude inventories fell by 1 million barrels in the week to October 16 to 488.1 million barrels, in line with analysts’ expectations in a Reuters poll.
U.S. gasoline stocks rose by 1.9 million barrels in the week, the EIA said, compared with expectations for a 1.8 million-barrel drop.
Distillate stockpiles, which include diesel and heating oil, fell by 3.8 million barrels to 160.7 million barrels, more than double the forecast for a 1.7 million-barrel drop, the EIA data showed.
Daily Swing Chart Technical Analysis
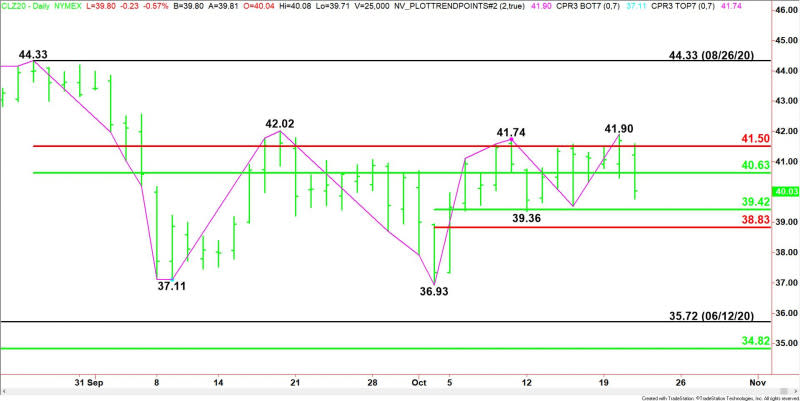
The main trend is up according to the daily swing chart. A trade through $39.36 will change the main trend to down. A move through $41.90 will signal a resumption of the uptrend.
The short-term range is $44.33 to $36.93. Its retracement zone at $40.63 to $41.50 is resistance.
The minor range is $36.93 to $41.90. Its retracement zone at $39.42 to $38.83 is the next downside target area.
Short-Term Outlook
On the bearish side, a change in trend to down will make $41.90 another secondary lower top. Taking out the minor Fibonacci level at $38.83 could trigger an acceleration to the downside with $36.93 the next major downside target.
On the bullish side, aggressive counter-trend buyers could come in on a test of $39.42 to $38.83. They are going to try to form a potentially bullish secondary higher-bottom. If successful, this could create the upside momentum needed to challenge $40.63, $41.50, $41.90 and $42.02.
These levels suggest a rally will be a labored event. However, the chart pattern indicates that $42.02 is a potential trigger point for an acceleration to the upside with $44.33 the next major upside target.
For a look at all of today’s economic events, check out our economic calendar.
This article was originally posted on FX Empire

