
 Yahoo News
 Does Ascom Holding AG (VTX:ASCN) Have A Good P/E Ratio?

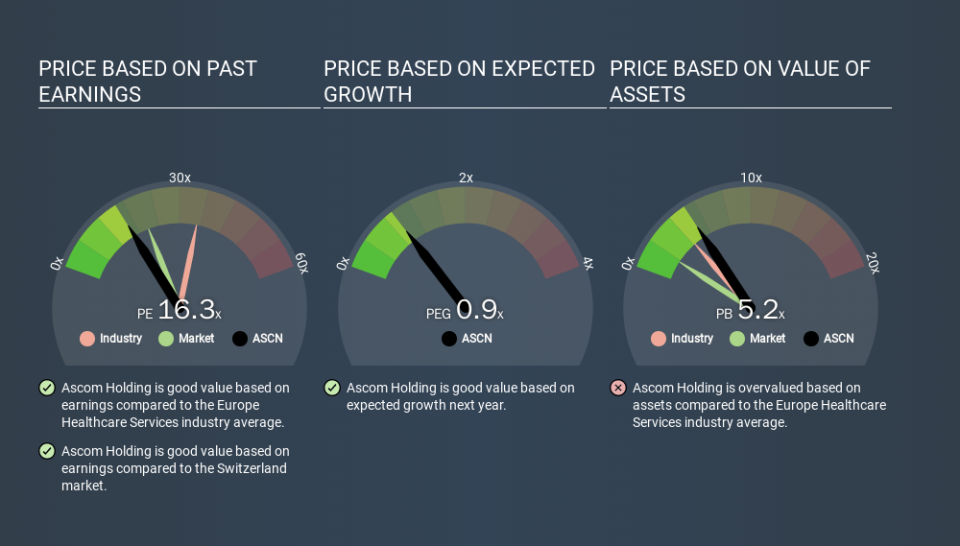
The goal of this article is to teach you how to use price to earnings ratios (P/E ratios). To keep it practical, we'll show how Ascom Holding AG's (VTX:ASCN) P/E ratio could help you assess the value on offer. Ascom Holding has a price to earnings ratio of 16.33, based on the last twelve months. That is equivalent to an earnings yield of about 6.1%.
View our latest analysis for Ascom Holding
How Do You Calculate A P/E Ratio?
The formula for P/E is:
Price to Earnings Ratio = Price per Share ÷ Earnings per Share (EPS)
Or for Ascom Holding:
P/E of 16.33 = CHF10.20 ÷ CHF0.62 (Based on the year to June 2019.)
Is A High Price-to-Earnings Ratio Good?
A higher P/E ratio means that investors are paying a higher price for each CHF1 of company earnings. All else being equal, it's better to pay a low price -- but as Warren Buffett said, 'It's far better to buy a wonderful company at a fair price than a fair company at a wonderful price'.
How Does Ascom Holding's P/E Ratio Compare To Its Peers?
We can get an indication of market expectations by looking at the P/E ratio. The image below shows that Ascom Holding has a lower P/E than the average (35.0) P/E for companies in the healthcare services industry.
Its relatively low P/E ratio indicates that Ascom Holding shareholders think it will struggle to do as well as other companies in its industry classification. While current expectations are low, the stock could be undervalued if the situation is better than the market assumes. It is arguably worth checking if insiders are buying shares, because that might imply they believe the stock is undervalued.
How Growth Rates Impact P/E Ratios
Earnings growth rates have a big influence on P/E ratios. When earnings grow, the 'E' increases, over time. Therefore, even if you pay a high multiple of earnings now, that multiple will become lower in the future. A lower P/E should indicate the stock is cheap relative to others -- and that may attract buyers.
Ascom Holding saw earnings per share decrease by 9.9% last year. But over the longer term (3 years), earnings per share have increased by 44%. And over the longer term (5 years) earnings per share have decreased 6.4% annually. So you wouldn't expect a very high P/E.
Don't Forget: The P/E Does Not Account For Debt or Bank Deposits
One drawback of using a P/E ratio is that it considers market capitalization, but not the balance sheet. In other words, it does not consider any debt or cash that the company may have on the balance sheet. Theoretically, a business can improve its earnings (and produce a lower P/E in the future) by investing in growth. That means taking on debt (or spending its cash).
Spending on growth might be good or bad a few years later, but the point is that the P/E ratio does not account for the option (or lack thereof).
Is Debt Impacting Ascom Holding's P/E?
Ascom Holding's net debt is 3.0% of its market cap. The market might award it a higher P/E ratio if it had net cash, but its unlikely this low level of net borrowing is having a big impact on the P/E multiple.
The Bottom Line On Ascom Holding's P/E Ratio
Ascom Holding has a P/E of 16.3. That's below the average in the CH market, which is 20.7. With only modest debt, it's likely the lack of EPS growth at least partially explains the pessimism implied by the P/E ratio.
When the market is wrong about a stock, it gives savvy investors an opportunity. If it is underestimating a company, investors can make money by buying and holding the shares until the market corrects itself. So this free report on the analyst consensus forecasts could help you make a master move on this stock.
But note: Ascom Holding may not be the best stock to buy. So take a peek at this free list of interesting companies with strong recent earnings growth (and a P/E ratio below 20).
If you spot an error that warrants correction, please contact the editor at editorial-team@simplywallst.com. This article by Simply Wall St is general in nature. It does not constitute a recommendation to buy or sell any stock, and does not take account of your objectives, or your financial situation. Simply Wall St has no position in the stocks mentioned.
We aim to bring you long-term focused research analysis driven by fundamental data. Note that our analysis may not factor in the latest price-sensitive company announcements or qualitative material. Thank you for reading.

