
 Yahoo News
 Does Diadrom Holding AB (publ) (STO:DIAH) Have A Good P/E Ratio?

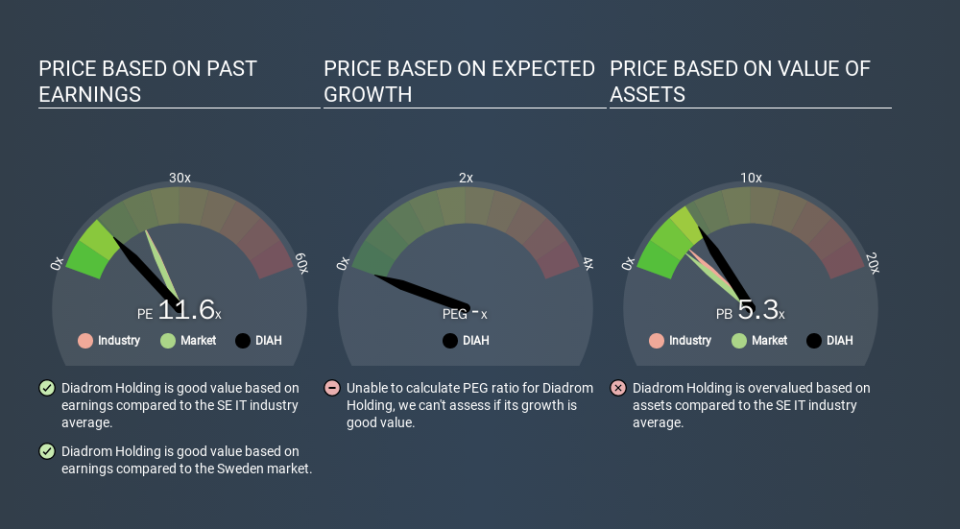
This article is for investors who would like to improve their understanding of price to earnings ratios (P/E ratios). We'll apply a basic P/E ratio analysis to Diadrom Holding AB (publ)'s (STO:DIAH), to help you decide if the stock is worth further research. What is Diadrom Holding's P/E ratio? Well, based on the last twelve months it is 11.62. That is equivalent to an earnings yield of about 8.6%.
View our latest analysis for Diadrom Holding
How Do I Calculate A Price To Earnings Ratio?
The formula for price to earnings is:
Price to Earnings Ratio = Share Price ÷ Earnings per Share (EPS)
Or for Diadrom Holding:
P/E of 11.62 = SEK12.35 ÷ SEK1.06 (Based on the year to September 2019.)
Is A High P/E Ratio Good?
A higher P/E ratio implies that investors pay a higher price for the earning power of the business. That isn't necessarily good or bad, but a high P/E implies relatively high expectations of what a company can achieve in the future.
How Does Diadrom Holding's P/E Ratio Compare To Its Peers?
The P/E ratio essentially measures market expectations of a company. We can see in the image below that the average P/E (20.1) for companies in the it industry is higher than Diadrom Holding's P/E.
Diadrom Holding's P/E tells us that market participants think it will not fare as well as its peers in the same industry. Since the market seems unimpressed with Diadrom Holding, it's quite possible it could surprise on the upside. If you consider the stock interesting, further research is recommended. For example, I often monitor director buying and selling.
How Growth Rates Impact P/E Ratios
Probably the most important factor in determining what P/E a company trades on is the earnings growth. If earnings are growing quickly, then the 'E' in the equation will increase faster than it would otherwise. That means unless the share price increases, the P/E will reduce in a few years. Then, a lower P/E should attract more buyers, pushing the share price up.
It's nice to see that Diadrom Holding grew EPS by a stonking 47% in the last year. And it has bolstered its earnings per share by 7.5% per year over the last five years. With that performance, I would expect it to have an above average P/E ratio.
Don't Forget: The P/E Does Not Account For Debt or Bank Deposits
One drawback of using a P/E ratio is that it considers market capitalization, but not the balance sheet. So it won't reflect the advantage of cash, or disadvantage of debt. Theoretically, a business can improve its earnings (and produce a lower P/E in the future) by investing in growth. That means taking on debt (or spending its cash).
Such expenditure might be good or bad, in the long term, but the point here is that the balance sheet is not reflected by this ratio.
How Does Diadrom Holding's Debt Impact Its P/E Ratio?
With net cash of kr12m, Diadrom Holding has a very strong balance sheet, which may be important for its business. Having said that, at 13% of its market capitalization the cash hoard would contribute towards a higher P/E ratio.
The Verdict On Diadrom Holding's P/E Ratio
Diadrom Holding trades on a P/E ratio of 11.6, which is below the SE market average of 19.8. It grew its EPS nicely over the last year, and the healthy balance sheet implies there is more potential for growth. The relatively low P/E ratio implies the market is pessimistic.
When the market is wrong about a stock, it gives savvy investors an opportunity. If the reality for a company is not as bad as the P/E ratio indicates, then the share price should increase as the market realizes this. Although we don't have analyst forecasts shareholders might want to examine this detailed historical graph of earnings, revenue and cash flow.
Of course you might be able to find a better stock than Diadrom Holding. So you may wish to see this free collection of other companies that have grown earnings strongly.
If you spot an error that warrants correction, please contact the editor at editorial-team@simplywallst.com. This article by Simply Wall St is general in nature. It does not constitute a recommendation to buy or sell any stock, and does not take account of your objectives, or your financial situation. Simply Wall St has no position in the stocks mentioned.
We aim to bring you long-term focused research analysis driven by fundamental data. Note that our analysis may not factor in the latest price-sensitive company announcements or qualitative material. Thank you for reading.

