
 Yahoo News
 Has Embelton Limited's (ASX:EMB) Impressive Stock Performance Got Anything to Do With Its Fundamentals?

Most readers would already be aware that Embelton's (ASX:EMB) stock increased significantly by 14% over the past three months. Given that stock prices are usually aligned with a company's financial performance in the long-term, we decided to study its financial indicators more closely to see if they had a hand to play in the recent price move. In this article, we decided to focus on Embelton's ROE.
Return on equity or ROE is a key measure used to assess how efficiently a company's management is utilizing the company's capital. In other words, it is a profitability ratio which measures the rate of return on the capital provided by the company's shareholders.
View our latest analysis for Embelton
How To Calculate Return On Equity?
The formula for return on equity is:
Return on Equity = Net Profit (from continuing operations) ÷ Shareholders' Equity
So, based on the above formula, the ROE for Embelton is:
12% = AU$2.2m ÷ AU$19m (Based on the trailing twelve months to June 2020).
The 'return' is the profit over the last twelve months. So, this means that for every A$1 of its shareholder's investments, the company generates a profit of A$0.12.
What Is The Relationship Between ROE And Earnings Growth?
So far, we've learned that ROE is a measure of a company's profitability. We now need to evaluate how much profit the company reinvests or "retains" for future growth which then gives us an idea about the growth potential of the company. Assuming everything else remains unchanged, the higher the ROE and profit retention, the higher the growth rate of a company compared to companies that don't necessarily bear these characteristics.
Embelton's Earnings Growth And 12% ROE
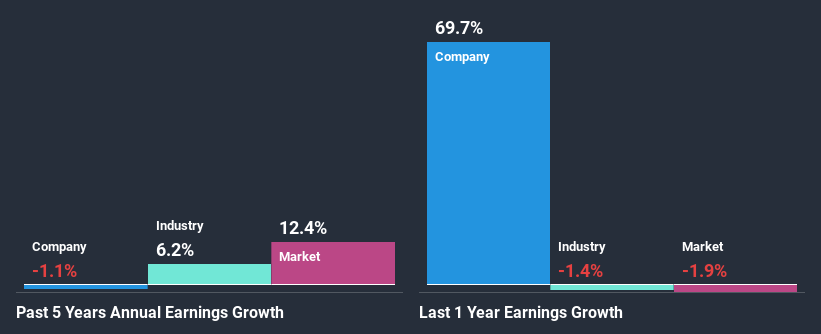
To start with, Embelton's ROE looks acceptable. Further, the company's ROE compares quite favorably to the industry average of 9.1%. Given the circumstances, we can't help but wonder why Embelton saw little to no growth in the past five years. We reckon that there could be some other factors at play here that's limiting the company's growth. These include low earnings retention or poor allocation of capital.
We then compared Embelton's net income growth with the industry and found that the average industry growth rate was 6.2% in the same period.
Earnings growth is an important metric to consider when valuing a stock. It’s important for an investor to know whether the market has priced in the company's expected earnings growth (or decline). By doing so, they will have an idea if the stock is headed into clear blue waters or if swampy waters await. One good indicator of expected earnings growth is the P/E ratio which determines the price the market is willing to pay for a stock based on its earnings prospects. So, you may want to check if Embelton is trading on a high P/E or a low P/E, relative to its industry.
Is Embelton Efficiently Re-investing Its Profits?
In spite of a normal three-year median payout ratio of 41% (or a retention ratio of 59%), Embelton hasn't seen much growth in its earnings. Therefore, there might be some other reasons to explain the lack in that respect. For example, the business could be in decline.
In addition, Embelton has been paying dividends over a period of at least ten years suggesting that keeping up dividend payments is way more important to the management even if it comes at the cost of business growth.
Summary
On the whole, we do feel that Embelton has some positive attributes. Although, we are disappointed to see a lack of growth in earnings even in spite of a high ROE and and a high reinvestment rate. We believe that there might be some outside factors that could be having a negative impact on the business. Up till now, we've only made a short study of the company's growth data. You can do your own research on Embelton and see how it has performed in the past by looking at this FREE detailed graph of past earnings, revenue and cash flows.
This article by Simply Wall St is general in nature. It does not constitute a recommendation to buy or sell any stock, and does not take account of your objectives, or your financial situation. We aim to bring you long-term focused analysis driven by fundamental data. Note that our analysis may not factor in the latest price-sensitive company announcements or qualitative material. Simply Wall St has no position in any stocks mentioned.
Have feedback on this article? Concerned about the content? Get in touch with us directly. Alternatively, email editorial-team@simplywallst.com.

