
 Yahoo News
 EUR/USD Mid-Session Technical Analysis for April 3, 2020
The Euro is trading lower against the U.S. Dollar on Thursday shortly after the release of bearish Euro Zone Services PMI data and ahead of the release of the March U.S. Non-Farm Payrolls report.
Business activity has cratered across Europe as attempts to contain the coronavirus pandemic push governments to shut down vast swathes of their economies, from shops to factories to restaurants, surveys showed on Friday, according to Reuters.
At 11:02 GMT, the EUR/USD is trading 1.0800, down 0.0059 or -0.54%.
A final composite PMI for the Euro Zone plummeted to a record low of 29.7 from February’s 51.6, lower than the flash reading of 31.4 and marking by far its biggest one-month drop since the survey began in July 1998.
IHS Markit said the data indicated the economy was already contracting at an annualized rate approaching 10% and warned worse was to come in the near future, Reuters said.
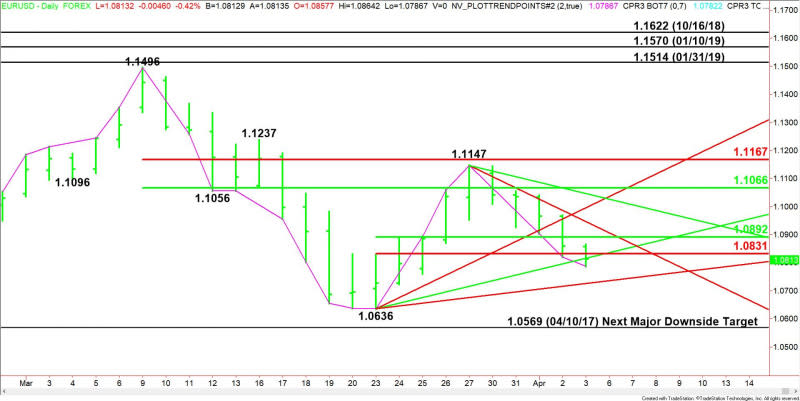
Daily Technical Analysis
The main trend is down according to the daily swing chart. A trade through 1.0636 will signal a resumption of the downtrend. The main trend will change to up on a move through 1.1147.
The main range is 1.1496 to 1.0636. Its retracement zone at 1.1066 to 1.1167 is resistance. This zone stopped the rally at 1.1147 on March 27.
The minor range is 1.0636 to 1.1147. Crossing to the weak side of its retracement zone at 1.0831 to 1.0892 is contributing to the bearish tone. This zone is now resistance.
Daily Technical Forecast
Based on the early price action and the current price at 1.0800, the direction of the EUR/USD the rest of the session on Friday is likely to be determined by trader reaction to the uptrending Gann angle at 1.0816 and the short-term Fibonacci level at 1.0831.
Bearish Scenario
A sustained move under 1.0816 will indicate the selling pressure is getting stronger. This could trigger a further break into the next uptrending Gann angle at 1.0726. This is the last potential support angle before the 1.0636 main bottom.
Bullish Scenario
Overcoming and sustaining a rally over the short-term Fib at 1.0831 will indicate the selling is getting weaker or the buying stronger. This could trigger a rally into the 50% level at 1.0892, followed by the downtrending Gann angle at 1.0947.
This article was originally posted on FX Empire

