
 Yahoo News
 EUR/USD Mid-Session Technical Analysis for January 24, 2020
The Euro is trading at a seven-week low against the U.S. Dollar on Friday after lackluster PMI data failed to impress traders enough to stop their aggressive selling. The data also supported the notion that the European Central Bank would have to maintain a loose monetary policy during the foreseeable future.
At 14:09 GMT, the EUR/USD is trading 1.1039, down 0.0021 or -0.19%.
Euro zone business activity remained weak at the start of the year, a survey showed a day after the European Central Bank said the manufacturing sector remained a drag on the economy, but there were some signs the worst may be over, Reuters reported.
IHS Markit’s Euro Zone Composite Flash Purchasing Managers’ Index (PMI), seen as a good gauge of economic health, held at 50.9 in January, missing the median prediction in a Reuters poll for 51.2. Anything above 50 indicates growth.
Daily Technical Analysis
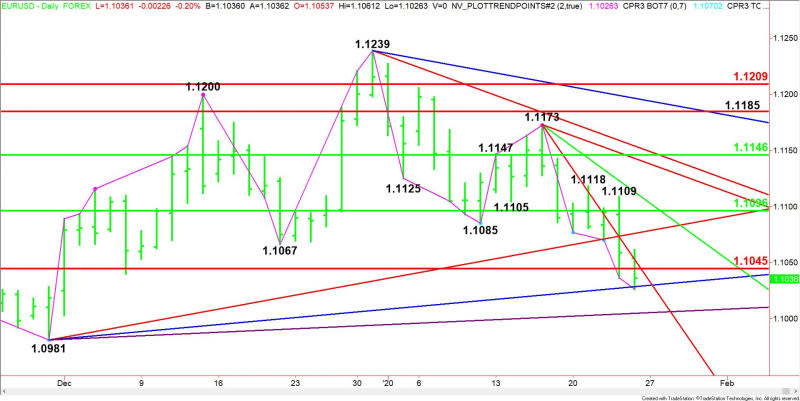
The main trend is down according to the daily swing chart. The downtrend was reaffirmed on Friday when buyers took out yesterday’s low at 1.1036. The main trend will change to up on a move through the last swing top at 1.1173.
The minor trend is also down. A trade through 1.1109 will change the minor trend to up. This will shift momentum to the upside.
On Thursday, the EUR/USD crossed to the weak side of a major retracement zone at 1.1045 to 1.1096. This zone is now resistance.
Daily Technical Forecast
Based on the early price action and the current price at 1.1039, the direction of the EUR/USD is likely to be determined by trader reaction to the Fibonacci level at 1.1045.
Bearish Scenario
A sustained move under 1.1045 will indicate the presence of sellers. The first downside target is an uptrending Gann angle at 1.1029. This angle stopped the selling earlier in the session.
Taking out 1.1029 will indicate the selling pressure is getting stronger. This could trigger an acceleration to the downside with the next target angle coming in at 1.1005. This is the last potential support angle before the 1.0981 main bottom.
Bullish Scenario
Holding 1.1029 will indicate some light buying, or that the selling pressure has slowed. This could lead to a test of the Fibonacci level at 1.1045 and the downtrending Gann angle at 1.1053.
Taking out 1.1053 could trigger an acceleration to the upside with the next target angle coming in at 1.1076.
This article was originally posted on FX Empire
More From FXEMPIRE:
Silver Weekly Price Forecast – Silver Markets Show Resiliency
GBP/JPY Weekly Price Forecast – British Pound Spotters Against Japanese Yen
GBP/USD Weekly Price Forecast – British Pound Rallies From Trendline
S&P 500 Price Forecast – Stock Markets Have Rough Into The Week
S&P 500 Weekly Price Forecast – Stock Markets Stall For The Week
