
 Yahoo News
 Examining CML Microsystems plc’s (LON:CML) Weak Return On Capital Employed

Today we'll evaluate CML Microsystems plc (LON:CML) to determine whether it could have potential as an investment idea. To be precise, we'll consider its Return On Capital Employed (ROCE), as that will inform our view of the quality of the business.
Firstly, we'll go over how we calculate ROCE. Next, we'll compare it to others in its industry. Then we'll determine how its current liabilities are affecting its ROCE.
Understanding Return On Capital Employed (ROCE)
ROCE measures the 'return' (pre-tax profit) a company generates from capital employed in its business. All else being equal, a better business will have a higher ROCE. In brief, it is a useful tool, but it is not without drawbacks. Renowned investment researcher Michael Mauboussin has suggested that a high ROCE can indicate that 'one dollar invested in the company generates value of more than one dollar'.
How Do You Calculate Return On Capital Employed?
The formula for calculating the return on capital employed is:
Return on Capital Employed = Earnings Before Interest and Tax (EBIT) ÷ (Total Assets - Current Liabilities)
Or for CML Microsystems:
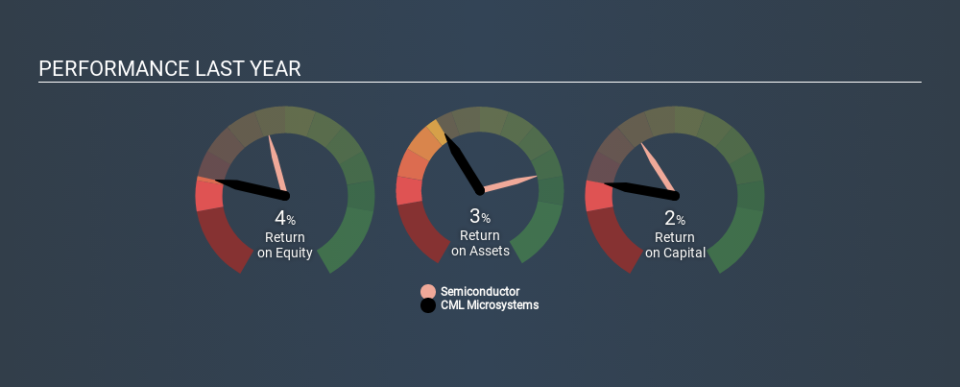
0.024 = UK£1.2m ÷ (UK£55m - UK£4.0m) (Based on the trailing twelve months to September 2019.)
Therefore, CML Microsystems has an ROCE of 2.4%.
See our latest analysis for CML Microsystems
Is CML Microsystems's ROCE Good?
ROCE is commonly used for comparing the performance of similar businesses. Using our data, CML Microsystems's ROCE appears to be significantly below the 12% average in the Semiconductor industry. This could be seen as a negative, as it suggests some competitors may be employing their capital more efficiently. Regardless of how CML Microsystems stacks up against its industry, its ROCE in absolute terms is quite low (especially compared to a bank account). Readers may wish to look for more rewarding investments.
CML Microsystems's current ROCE of 2.4% is lower than its ROCE in the past, which was 8.1%, 3 years ago. Therefore we wonder if the company is facing new headwinds. You can click on the image below to see (in greater detail) how CML Microsystems's past growth compares to other companies.
When considering this metric, keep in mind that it is backwards looking, and not necessarily predictive. ROCE can be deceptive for cyclical businesses, as returns can look incredible in boom times, and terribly low in downturns. ROCE is, after all, simply a snap shot of a single year. Future performance is what matters, and you can see analyst predictions in our free report on analyst forecasts for the company.
CML Microsystems's Current Liabilities And Their Impact On Its ROCE
Liabilities, such as supplier bills and bank overdrafts, are referred to as current liabilities if they need to be paid within 12 months. Due to the way the ROCE equation works, having large bills due in the near term can make it look as though a company has less capital employed, and thus a higher ROCE than usual. To counteract this, we check if a company has high current liabilities, relative to its total assets.
CML Microsystems has current liabilities of UK£4.0m and total assets of UK£55m. Therefore its current liabilities are equivalent to approximately 7.3% of its total assets. With barely any current liabilities, there is minimal impact on CML Microsystems's admittedly low ROCE.
Our Take On CML Microsystems's ROCE
Nonetheless, there may be better places to invest your capital. Of course, you might find a fantastic investment by looking at a few good candidates. So take a peek at this free list of companies with modest (or no) debt, trading on a P/E below 20.
If you like to buy stocks alongside management, then you might just love this free list of companies. (Hint: insiders have been buying them).
If you spot an error that warrants correction, please contact the editor at editorial-team@simplywallst.com. This article by Simply Wall St is general in nature. It does not constitute a recommendation to buy or sell any stock, and does not take account of your objectives, or your financial situation. Simply Wall St has no position in the stocks mentioned.
We aim to bring you long-term focused research analysis driven by fundamental data. Note that our analysis may not factor in the latest price-sensitive company announcements or qualitative material. Thank you for reading.

