
 Yahoo News
 Is Finlogic S.p.A.'s (BIT:FNL) High P/E Ratio A Problem For Investors?

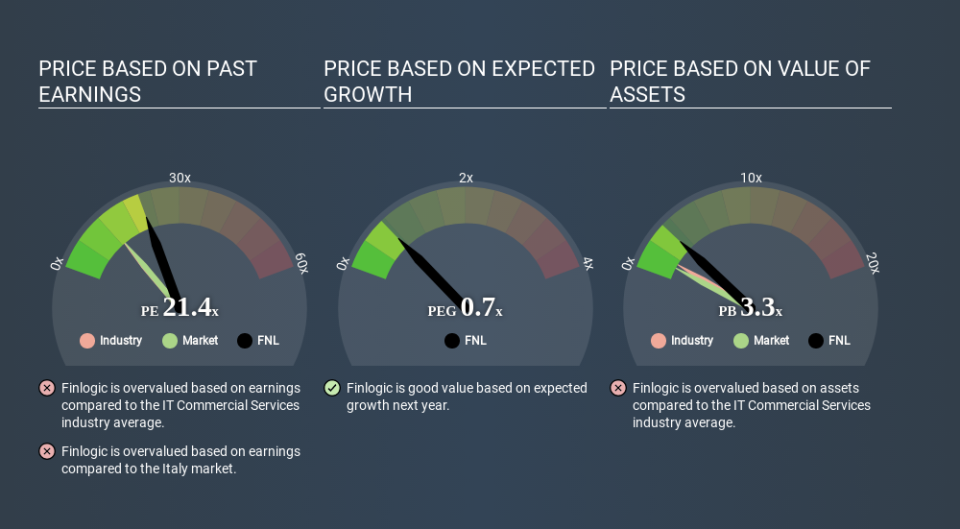
Today, we'll introduce the concept of the P/E ratio for those who are learning about investing. To keep it practical, we'll show how Finlogic S.p.A.'s (BIT:FNL) P/E ratio could help you assess the value on offer. Finlogic has a price to earnings ratio of 21.41, based on the last twelve months. That corresponds to an earnings yield of approximately 4.7%.
View our latest analysis for Finlogic
How Do I Calculate A Price To Earnings Ratio?
The formula for P/E is:
Price to Earnings Ratio = Share Price ÷ Earnings per Share (EPS)
Or for Finlogic:
P/E of 21.41 = €6.450 ÷ €0.301 (Based on the year to June 2019.)
(Note: the above calculation results may not be precise due to rounding.)
Is A High Price-to-Earnings Ratio Good?
The higher the P/E ratio, the higher the price tag of a business, relative to its trailing earnings. That isn't a good or a bad thing on its own, but a high P/E means that buyers have a higher opinion of the business's prospects, relative to stocks with a lower P/E.
How Does Finlogic's P/E Ratio Compare To Its Peers?
One good way to get a quick read on what market participants expect of a company is to look at its P/E ratio. As you can see below, Finlogic has a higher P/E than the average company (12.3) in the commercial services industry.
That means that the market expects Finlogic will outperform other companies in its industry. The market is optimistic about the future, but that doesn't guarantee future growth. So further research is always essential. I often monitor director buying and selling.
How Growth Rates Impact P/E Ratios
If earnings fall then in the future the 'E' will be lower. Therefore, even if you pay a low multiple of earnings now, that multiple will become higher in the future. Then, a higher P/E might scare off shareholders, pushing the share price down.
Finlogic increased earnings per share by an impressive 17% over the last twelve months. But earnings per share are down 40% per year over the last three years.
Don't Forget: The P/E Does Not Account For Debt or Bank Deposits
The 'Price' in P/E reflects the market capitalization of the company. Thus, the metric does not reflect cash or debt held by the company. The exact same company would hypothetically deserve a higher P/E ratio if it had a strong balance sheet, than if it had a weak one with lots of debt, because a cashed up company can spend on growth.
Such spending might be good or bad, overall, but the key point here is that you need to look at debt to understand the P/E ratio in context.
How Does Finlogic's Debt Impact Its P/E Ratio?
Finlogic has net cash of €3.4m. That should lead to a higher P/E than if it did have debt, because its strong balance sheets gives it more options.
The Bottom Line On Finlogic's P/E Ratio
Finlogic has a P/E of 21.4. That's higher than the average in its market, which is 12.5. Its net cash position supports a higher P/E ratio, as does its solid recent earnings growth. Therefore it seems reasonable that the market would have relatively high expectations of the company
Investors have an opportunity when market expectations about a stock are wrong. People often underestimate remarkable growth -- so investors can make money when fast growth is not fully appreciated. So this free visual report on analyst forecasts could hold the key to an excellent investment decision.
Of course, you might find a fantastic investment by looking at a few good candidates. So take a peek at this free list of companies with modest (or no) debt, trading on a P/E below 20.
If you spot an error that warrants correction, please contact the editor at editorial-team@simplywallst.com. This article by Simply Wall St is general in nature. It does not constitute a recommendation to buy or sell any stock, and does not take account of your objectives, or your financial situation. Simply Wall St has no position in the stocks mentioned.
We aim to bring you long-term focused research analysis driven by fundamental data. Note that our analysis may not factor in the latest price-sensitive company announcements or qualitative material. Thank you for reading.

