
 Yahoo News
 How geological maps made the Apollo moon landings worthwhile

I still remember a cartoon in a newspaper in July 1969, just before the first Apollo moon landing. It showed the ground crew reminding the astronauts as they boarded their rocket, “Don’t forget to bring back some rock!” This was a nod to an old holiday cliché – people who went to the seaside were often asked to bring back some “rock”, referring to rock candy. It wasn’t very funny, but it does demonstrate that, once the race against the Soviets was won, the point of it all was to find out about the moon’s geology.
The scientific value of landing on the moon would have been diminished without studies to establish the context of the landing sites. The primary consideration was to touch down somewhere safe, but rocks collected from these places would have conveyed much less information had effort not gone into working out the nature of, and more importantly the relationships between, the rock units from which the samples were collected.
This was done by making detailed geological maps, using the same principles that geologists use on Earth.
Cartography vs. geological mapping
Telescopic observers had already begun to draw general maps of the moon’s near side (which is all that can be seen from Earth) in the 1600s. These were essentially exercises in cartography, documenting what the moon looks like. Soon names were being marked to label individual features, but this was just a convenient way to identify them. It wasn’t based on any actual understanding.
By contrast, geologists make maps to gain insight into the history of a region. They distinguish tracts of terrain of which the ages – and therefore possibly origin and composition – can be deduced to be different. This is usually achieved by working out what is on top of what (younger layers will generally be on top of older layers) and cross-cutting relationships (younger features can cut across older ones, but not vice versa).
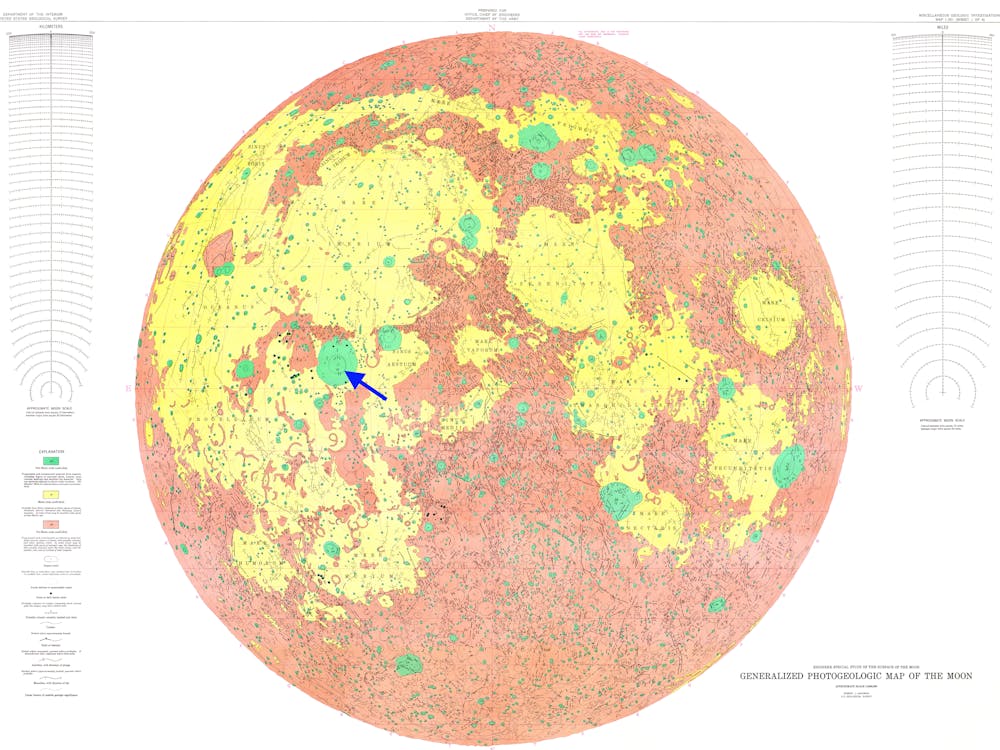
The first published attempt to use these principles on the moon was a 1960 study by geologists Robert J. Hackman and Arnold C. Mason. It was based entirely on telescopic observations, and showed the dark patches – the “maria” – lumped together as all of the same age in yellow, overlying “pre-maria” terrain, thought to be older, in brown. The youngest unit was called “post-maria rocks”, shown in green, which was interpreted to be craters and ejecta from them that were formed after the maria.
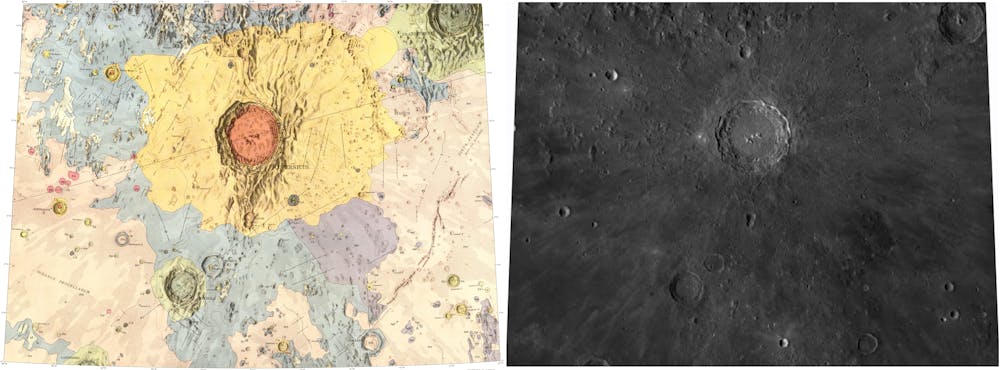
With only three age categories, this map was very basic, and was soon superseded by more detailed studies. In 1961, geologist Gene Shoemaker circulated a prototype geology map of the area around the crater Copernicus. Shoemaker divided the materials he could see on the surface into five age classes and further subdivided some of these according to texture – such as “smooth” versus “hummocky”. He also offered interpretations for each of his units, such as “probably chiefly crushed rock” and “probably volcanic flows”. He even included cross sections indicating what structures may lie below the surface to a depth of several kilometres.
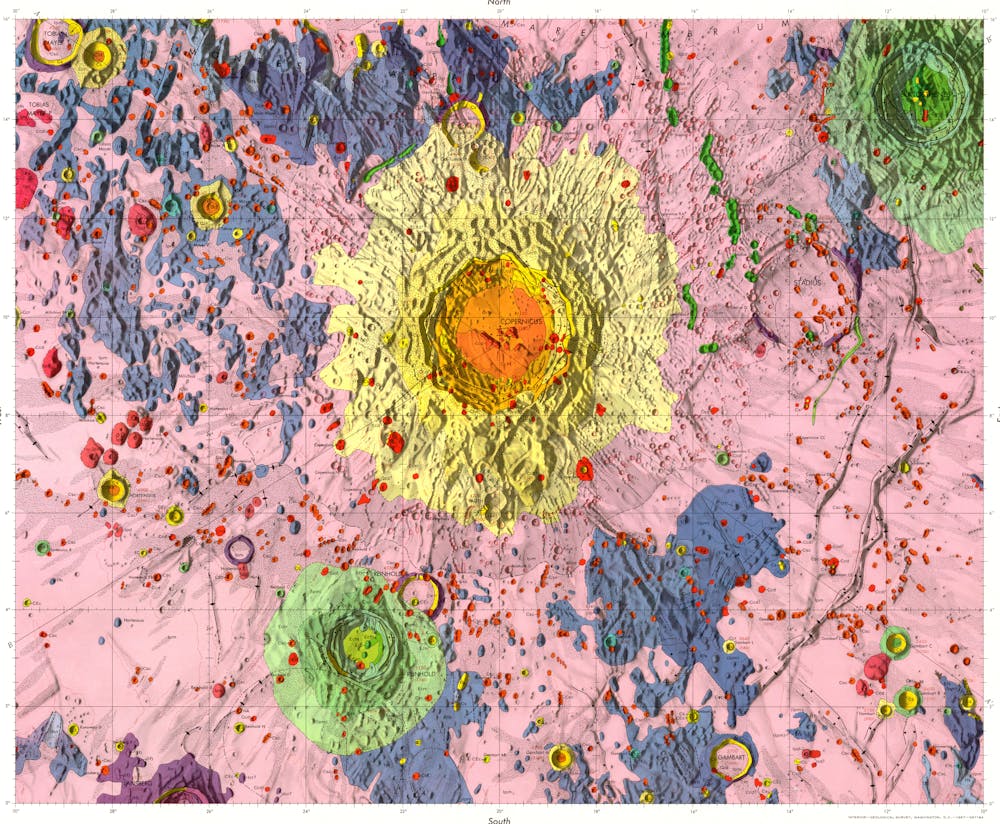
Shoemaker collaborated with two colleagues to publish a considerably more detailed map of the same area in 1967. This was based on photographic images obtained by ground-based telescopes, supplemented by visual observations made using the 24-inch Lowell refracting telescope at Flagstaff, Arizona, to check fine details. The first-named author of this map was H.H. Schmitt, more commonly known as Jack Schmitt, who as the Apollo 17 Lunar Module pilot in 1972 became the first – and to date, only – professionally qualified geologist to walk on the moon.
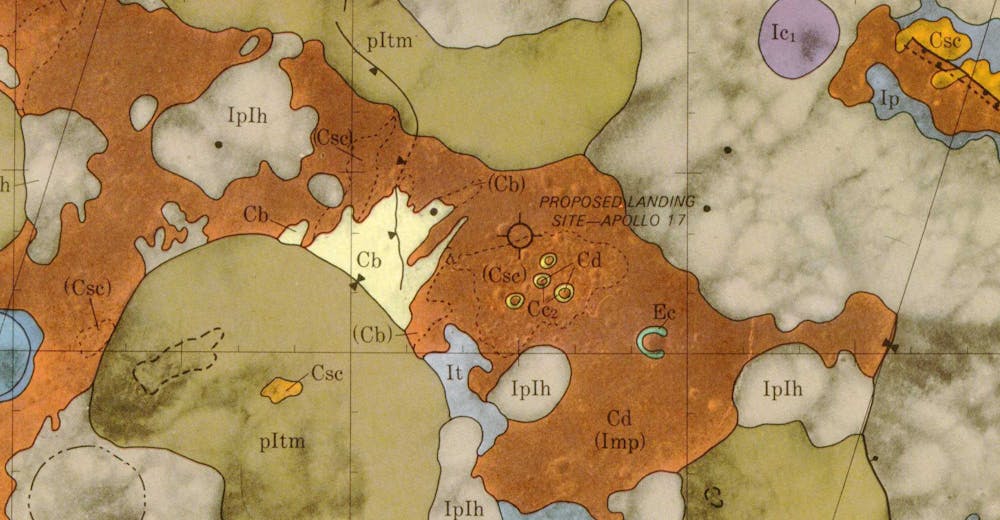
Landing site maps
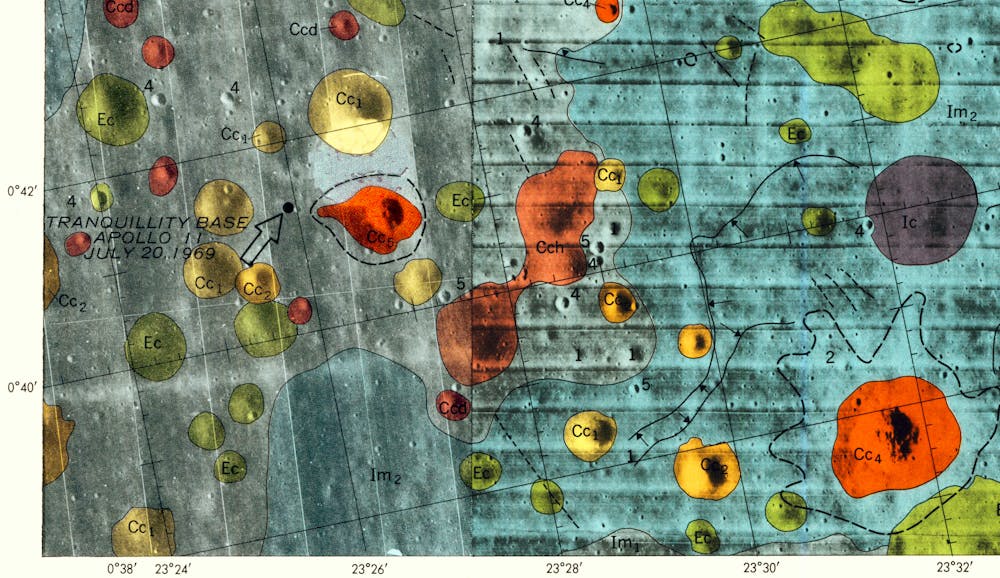
Subsequent lunar maps began to use pictures obtained by spacecraft orbiting the moon ahead of Apollo 11. Maps were made of all the proposed Apollo landing sites, including some that were never visited. At first, these relied heavily on photographs taken by the five Lunar Orbiter uncrewed lunar satellites. Later Apollo landing sites were mapped with the aid of pictures taken during earlier Apollo missions.
Although the moon walkers discovered that some of the geology mapped from orbit had been misinterpreted, each unit did prove to be genuinely worth investigating so that time on the surface was better spent than by blundering around at random. For example, the Cayley Plains where Apollo 16 landed were thought to be volcanic, but turned out to be an equally interesting unit made of welded lumps of older rock fragmented by impacts.
Geological mapping continues today, even on bodies where there is no prospect of human visitors in the forseeable future. The United States Geological Survey, which published the Apollo maps, has since published maps of at least parts of every other rocky planet and several smaller rocky or icy bodies. In Europe, an effort is underway to prepare the first detailed geological maps of the whole of Mercury in preparation for the 2025 arrival of BepiColombo in orbit about the planet.
Some of those maps are being disseminated by the European Commission project Planmap, which is also preparing immersive 3D virtual environments of potential landing sites on the moon and Mars for astronaut training.
Ultimately, we have the Apollo missions to thank for a lot of our geological knowledge about the moon. The geological maps and the rock samples they enabled astronauts to bring back to Earth have given us invaluable information about the history of the moon, even though some of the haul has yet to be studied, 50 years on.
This article is republished from The Conversation under a Creative Commons license. Read the original article.

David Rothery is co-leader of the European Space Agency's Mercury Surface and Composition Working Group, and a Co-Investigator on MIXS (Mercury Imaging X-ray Spectrometer) that is now on its way to Mercury on board the European Space Agency's Mercury orbiter BepiColombo. He has received funding from the UK Space Agency and the Science & Technology Facilities Council for work related to Mercury BepiColombo, and is currently funded by the European Commission under its Horizon 2020 programme for work on planetary geological mapping (776276 Planmap). He is author of Planet Mercury - from Pale Pink Dot to Dynamic World (Springer, 2015), Moons: A Very Short Introduction (Oxford University Press, 2015) and Planets: A Very Short Introduction (Oxford University Press, 2010). He is Educator on the Open University's free learning Badged Open Course (BOC) on Moons and its equivalent FutureLearn Moons MOOC, and chair of the Open University's level 2 course on Planetary Science and the Search for Life.
