
 Yahoo News
 Here's How P/E Ratios Can Help Us Understand The Hour Glass Limited (SGX:AGS)

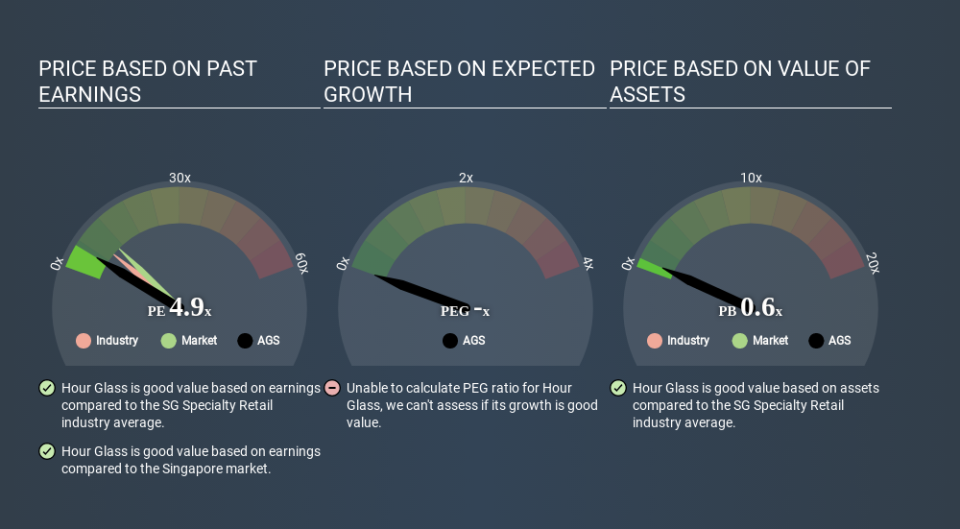
Today, we'll introduce the concept of the P/E ratio for those who are learning about investing. To keep it practical, we'll show how The Hour Glass Limited's (SGX:AGS) P/E ratio could help you assess the value on offer. Hour Glass has a P/E ratio of 4.89, based on the last twelve months. That is equivalent to an earnings yield of about 20.5%.
Check out our latest analysis for Hour Glass
How Do You Calculate A P/E Ratio?
The formula for P/E is:
Price to Earnings Ratio = Share Price ÷ Earnings per Share (EPS)
Or for Hour Glass:
P/E of 4.89 = SGD0.540 ÷ SGD0.111 (Based on the year to December 2019.)
(Note: the above calculation results may not be precise due to rounding.)
Is A High P/E Ratio Good?
A higher P/E ratio means that buyers have to pay a higher price for each SGD1 the company has earned over the last year. That isn't necessarily good or bad, but a high P/E implies relatively high expectations of what a company can achieve in the future.
Does Hour Glass Have A Relatively High Or Low P/E For Its Industry?
One good way to get a quick read on what market participants expect of a company is to look at its P/E ratio. We can see in the image below that the average P/E (8.2) for companies in the specialty retail industry is higher than Hour Glass's P/E.
Its relatively low P/E ratio indicates that Hour Glass shareholders think it will struggle to do as well as other companies in its industry classification. Many investors like to buy stocks when the market is pessimistic about their prospects. If you consider the stock interesting, further research is recommended. For example, I often monitor director buying and selling.
How Growth Rates Impact P/E Ratios
Earnings growth rates have a big influence on P/E ratios. Earnings growth means that in the future the 'E' will be higher. That means even if the current P/E is high, it will reduce over time if the share price stays flat. So while a stock may look expensive based on past earnings, it could be cheap based on future earnings.
Hour Glass increased earnings per share by an impressive 22% over the last twelve months. And it has bolstered its earnings per share by 6.2% per year over the last five years. With that performance, you might expect an above average P/E ratio.
Remember: P/E Ratios Don't Consider The Balance Sheet
One drawback of using a P/E ratio is that it considers market capitalization, but not the balance sheet. That means it doesn't take debt or cash into account. Hypothetically, a company could reduce its future P/E ratio by spending its cash (or taking on debt) to achieve higher earnings.
Such spending might be good or bad, overall, but the key point here is that you need to look at debt to understand the P/E ratio in context.
Hour Glass's Balance Sheet
Hour Glass has net cash of S$151m. This is fairly high at 40% of its market capitalization. That might mean balance sheet strength is important to the business, but should also help push the P/E a bit higher than it would otherwise be.
The Verdict On Hour Glass's P/E Ratio
Hour Glass has a P/E of 4.9. That's below the average in the SG market, which is 10.5. It grew its EPS nicely over the last year, and the healthy balance sheet implies there is more potential for growth. One might conclude that the market is a bit pessimistic, given the low P/E ratio.
When the market is wrong about a stock, it gives savvy investors an opportunity. As value investor Benjamin Graham famously said, 'In the short run, the market is a voting machine but in the long run, it is a weighing machine. Although we don't have analyst forecasts you might want to assess this data-rich visualization of earnings, revenue and cash flow.
Of course, you might find a fantastic investment by looking at a few good candidates. So take a peek at this free list of companies with modest (or no) debt, trading on a P/E below 20.
If you spot an error that warrants correction, please contact the editor at editorial-team@simplywallst.com. This article by Simply Wall St is general in nature. It does not constitute a recommendation to buy or sell any stock, and does not take account of your objectives, or your financial situation. Simply Wall St has no position in the stocks mentioned.
We aim to bring you long-term focused research analysis driven by fundamental data. Note that our analysis may not factor in the latest price-sensitive company announcements or qualitative material. Thank you for reading.

