
 Yahoo News
 Is IVS Group S.A. (BIT:IVS) Investing Your Capital Efficiently?

Today we'll look at IVS Group S.A. (BIT:IVS) and reflect on its potential as an investment. Specifically, we'll consider its Return On Capital Employed (ROCE), since that will give us an insight into how efficiently the business can generate profits from the capital it requires.
First up, we'll look at what ROCE is and how we calculate it. Then we'll compare its ROCE to similar companies. And finally, we'll look at how its current liabilities are impacting its ROCE.
What is Return On Capital Employed (ROCE)?
ROCE is a metric for evaluating how much pre-tax income (in percentage terms) a company earns on the capital invested in its business. All else being equal, a better business will have a higher ROCE. In brief, it is a useful tool, but it is not without drawbacks. Renowned investment researcher Michael Mauboussin has suggested that a high ROCE can indicate that 'one dollar invested in the company generates value of more than one dollar'.
How Do You Calculate Return On Capital Employed?
Analysts use this formula to calculate return on capital employed:
Return on Capital Employed = Earnings Before Interest and Tax (EBIT) ÷ (Total Assets - Current Liabilities)
Or for IVS Group:
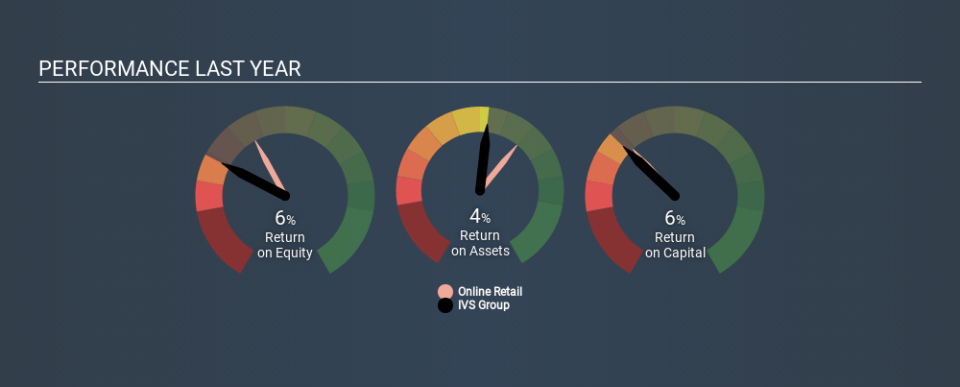
0.065 = €52m ÷ (€965m - €160m) (Based on the trailing twelve months to December 2019.)
So, IVS Group has an ROCE of 6.5%.
Check out our latest analysis for IVS Group
Is IVS Group's ROCE Good?
ROCE can be useful when making comparisons, such as between similar companies. We can see IVS Group's ROCE is meaningfully below the Online Retail industry average of 8.5%. This performance is not ideal, as it suggests the company may not be deploying its capital as effectively as some competitors. Setting aside the industry comparison for now, IVS Group's ROCE is mediocre in absolute terms, considering the risk of investing in stocks versus the safety of a bank account. Readers may find more attractive investment prospects elsewhere.
You can click on the image below to see (in greater detail) how IVS Group's past growth compares to other companies.
Remember that this metric is backwards looking - it shows what has happened in the past, and does not accurately predict the future. Companies in cyclical industries can be difficult to understand using ROCE, as returns typically look high during boom times, and low during busts. ROCE is only a point-in-time measure. Since the future is so important for investors, you should check out our free report on analyst forecasts for IVS Group.
IVS Group's Current Liabilities And Their Impact On Its ROCE
Current liabilities include invoices, such as supplier payments, short-term debt, or a tax bill, that need to be paid within 12 months. Due to the way the ROCE equation works, having large bills due in the near term can make it look as though a company has less capital employed, and thus a higher ROCE than usual. To counter this, investors can check if a company has high current liabilities relative to total assets.
IVS Group has total assets of €965m and current liabilities of €160m. Therefore its current liabilities are equivalent to approximately 17% of its total assets. It is good to see a restrained amount of current liabilities, as this limits the effect on ROCE.
Our Take On IVS Group's ROCE
With that in mind, we're not overly impressed with IVS Group's ROCE, so it may not be the most appealing prospect. Of course, you might find a fantastic investment by looking at a few good candidates. So take a peek at this free list of companies with modest (or no) debt, trading on a P/E below 20.
For those who like to find winning investments this free list of growing companies with recent insider purchasing, could be just the ticket.
If you spot an error that warrants correction, please contact the editor at editorial-team@simplywallst.com. This article by Simply Wall St is general in nature. It does not constitute a recommendation to buy or sell any stock, and does not take account of your objectives, or your financial situation. Simply Wall St has no position in the stocks mentioned.
We aim to bring you long-term focused research analysis driven by fundamental data. Note that our analysis may not factor in the latest price-sensitive company announcements or qualitative material. Thank you for reading.

