
 Yahoo News
 Latest weekly Covid-19 rates for local authority areas in Scotland
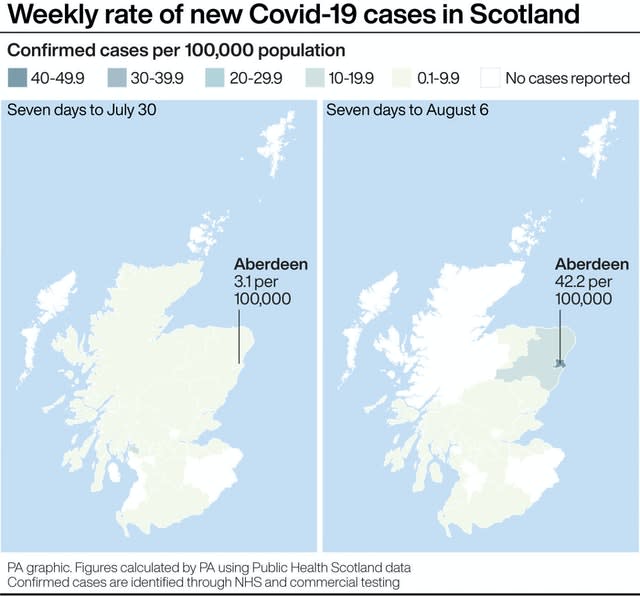
Here are the latest weekly rates of new cases of Covid-19 for every local authority area in Scotland.
The figures, for the seven days to August 6, are based on tests carried out in NHS laboratories and by commercial partners.
The rate is expressed as the number of new cases per 100,000 people.
The list has been calculated by the PA news agency and is based on data published by Public Health Scotland.
Here is the list in full. From left to right, it reads: name of local authority; the rate of new cases in the seven days to August 6; the number (in brackets) of new cases recorded in the seven days to August 6; the rate of new cases in the seven days to July 30; the number (in brackets) of new cases recorded in the seven days to July 30.
Aberdeen City 42.4 (97), 3.1 (7)
Aberdeenshire 14.2 (37), 1.1 (3)
East Renfrewshire 8.4 (8), 0.0 (0)
East Dunbartonshire 5.5 (6), 5.5 (6)
Renfrewshire 5.0 (9), 1.7 (3)
Glasgow City 4.6 (29), 3.0 (19)
West Dunbartonshire 3.4 (3), 2.2 (2)
Argyll and Bute 2.3 (2), 1.2 (1)
Dundee City 2.0 (3), 3.3 (5)
Angus 1.7 (2), 0.9 (1)
West Lothian 1.6 (3), 2.7 (5)
North Lanarkshire 1.5 (5), 2.6 (9)
Dumfries and Galloway 1.3 (2), 2.0 (3)
Fife 1.3 (5), 1.9 (7)
City of Edinburgh 1.3 (7), 1.7 (9)
Falkirk 1.2 (2), 3.1 (5)
Midlothian 1.1 (1), 1.1 (1)
Stirling 1.1 (1), 1.1 (1)
Moray 1.0 (1), 2.1 (2)
South Lanarkshire 0.9 (3), 0.6 (2)
East Lothian 0.9 (1), 2.8 (3)
South Ayrshire 0.9 (1), 0.0 (0)
North Ayrshire 0.7 (1), 0.0 (0)
Perth and Kinross 0.7 (1), 2.0 (3)
Inverclyde 0.0 (0), 11.6 (9)
East Ayrshire 0.0 (0), 2.5 (3)
Highland 0.0 (0), 0.4 (1)
Scottish Borders 0.0 (0), 0.0 (0)
Clackmannanshire 0.0 (0), 0.0 (0)
Na h-Eileanan Siar 0.0 (0), 0.0 (0)
Orkney Islands 0.0 (0), 0.0 (0)
Shetland Islands 0.0 (0), 0.0 (0)

