
 Yahoo News
 A Look At Bel Fuse's (NASDAQ:BELF.B) Share Price Returns

If you are building a properly diversified stock portfolio, the chances are some of your picks will perform badly. But long term Bel Fuse Inc. (NASDAQ:BELF.B) shareholders have had a particularly rough ride in the last three year. Sadly for them, the share price is down 61% in that time. And the ride hasn't got any smoother in recent times over the last year, with the price 38% lower in that time. Even worse, it's down 25% in about a month, which isn't fun at all.
See our latest analysis for Bel Fuse
While the efficient markets hypothesis continues to be taught by some, it has been proven that markets are over-reactive dynamic systems, and investors are not always rational. One way to examine how market sentiment has changed over time is to look at the interaction between a company's share price and its earnings per share (EPS).
Bel Fuse saw its share price decline over the three years in which its EPS also dropped, falling to a loss. Due to the loss, it's not easy to use EPS as a reliable guide to the business. However, we can say we'd expect to see a falling share price in this scenario.
You can see below how EPS has changed over time (discover the exact values by clicking on the image).
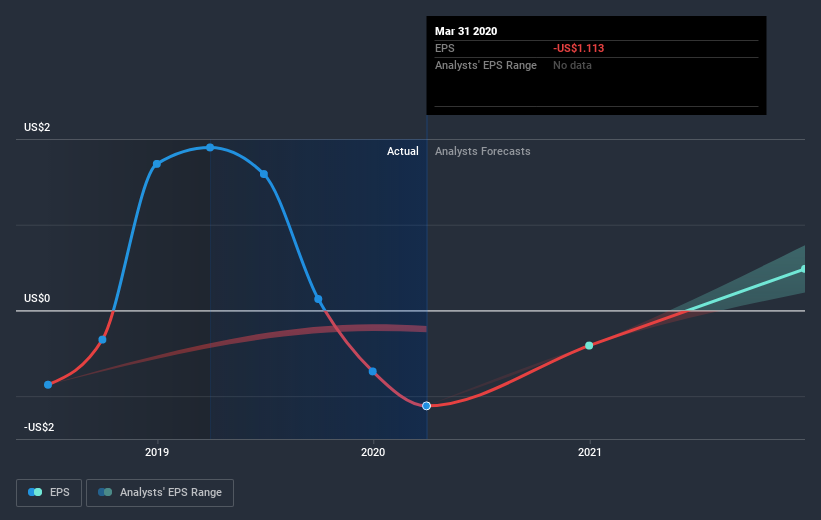
Dive deeper into Bel Fuse's key metrics by checking this interactive graph of Bel Fuse's earnings, revenue and cash flow.
What about the Total Shareholder Return (TSR)?
We'd be remiss not to mention the difference between Bel Fuse's total shareholder return (TSR) and its share price return. The TSR attempts to capture the value of dividends (as if they were reinvested) as well as any spin-offs or discounted capital raisings offered to shareholders. Its history of dividend payouts mean that Bel Fuse's TSR, which was a 59% drop over the last 3 years, was not as bad as the share price return.
A Different Perspective
Investors in Bel Fuse had a tough year, with a total loss of 37% (including dividends) , against a market gain of about 9.0%. However, keep in mind that even the best stocks will sometimes underperform the market over a twelve month period. Unfortunately, last year's performance may indicate unresolved challenges, given that it was worse than the annualised loss of 14% over the last half decade. Generally speaking long term share price weakness can be a bad sign, though contrarian investors might want to research the stock in hope of a turnaround. While it is well worth considering the different impacts that market conditions can have on the share price, there are other factors that are even more important. To that end, you should be aware of the 4 warning signs we've spotted with Bel Fuse .
If you would prefer to check out another company -- one with potentially superior financials -- then do not miss this free list of companies that have proven they can grow earnings.
Please note, the market returns quoted in this article reflect the market weighted average returns of stocks that currently trade on US exchanges.
This article by Simply Wall St is general in nature. It does not constitute a recommendation to buy or sell any stock, and does not take account of your objectives, or your financial situation. We aim to bring you long-term focused analysis driven by fundamental data. Note that our analysis may not factor in the latest price-sensitive company announcements or qualitative material. Simply Wall St has no position in any stocks mentioned.
Have feedback on this article? Concerned about the content? Get in touch with us directly. Alternatively, email editorial-team@simplywallst.com.

