
 Yahoo News
 A Look At The Fair Value Of Solaris Oilfield Infrastructure, Inc. (NYSE:SOI)

Today we'll do a simple run through of a valuation method used to estimate the attractiveness of Solaris Oilfield Infrastructure, Inc. (NYSE:SOI) as an investment opportunity by taking the forecast future cash flows of the company and discounting them back to today's value. One way to achieve this is by employing the Discounted Cash Flow (DCF) model. Models like these may appear beyond the comprehension of a lay person, but they're fairly easy to follow.
We would caution that there are many ways of valuing a company and, like the DCF, each technique has advantages and disadvantages in certain scenarios. Anyone interested in learning a bit more about intrinsic value should have a read of the Simply Wall St analysis model.
View our latest analysis for Solaris Oilfield Infrastructure
The model
We use what is known as a 2-stage model, which simply means we have two different periods of growth rates for the company's cash flows. Generally the first stage is higher growth, and the second stage is a lower growth phase. To start off with, we need to estimate the next ten years of cash flows. Where possible we use analyst estimates, but when these aren't available we extrapolate the previous free cash flow (FCF) from the last estimate or reported value. We assume companies with shrinking free cash flow will slow their rate of shrinkage, and that companies with growing free cash flow will see their growth rate slow, over this period. We do this to reflect that growth tends to slow more in the early years than it does in later years.
Generally we assume that a dollar today is more valuable than a dollar in the future, so we need to discount the sum of these future cash flows to arrive at a present value estimate:
10-year free cash flow (FCF) estimate
2021 | 2022 | 2023 | 2024 | 2025 | 2026 | 2027 | 2028 | 2029 | 2030 | |
Levered FCF ($, Millions) | US$14.7m | US$22.8m | US$26.4m | US$29.5m | US$32.2m | US$34.4m | US$36.4m | US$38.0m | US$39.5m | US$40.8m |
Growth Rate Estimate Source | Analyst x4 | Analyst x2 | Est @ 16.06% | Est @ 11.9% | Est @ 9% | Est @ 6.97% | Est @ 5.54% | Est @ 4.55% | Est @ 3.85% | Est @ 3.36% |
Present Value ($, Millions) Discounted @ 10% | US$13.4 | US$18.8 | US$19.8 | US$20.2 | US$20.0 | US$19.4 | US$18.7 | US$17.7 | US$16.7 | US$15.7 |
("Est" = FCF growth rate estimated by Simply Wall St)
Present Value of 10-year Cash Flow (PVCF) = US$180m
After calculating the present value of future cash flows in the initial 10-year period, we need to calculate the Terminal Value, which accounts for all future cash flows beyond the first stage. For a number of reasons a very conservative growth rate is used that cannot exceed that of a country's GDP growth. In this case we have used the 5-year average of the 10-year government bond yield (2.2%) to estimate future growth. In the same way as with the 10-year 'growth' period, we discount future cash flows to today's value, using a cost of equity of 10%.
Terminal Value (TV)= FCF2030 × (1 + g) ÷ (r – g) = US$41m× (1 + 2.2%) ÷ (10%– 2.2%) = US$536m
Present Value of Terminal Value (PVTV)= TV / (1 + r)10= US$536m÷ ( 1 + 10%)10= US$207m
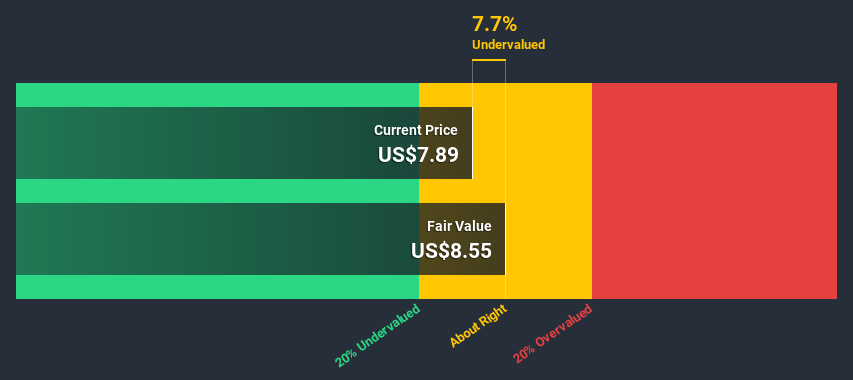
The total value, or equity value, is then the sum of the present value of the future cash flows, which in this case is US$387m. In the final step we divide the equity value by the number of shares outstanding. Relative to the current share price of US$7.9, the company appears about fair value at a 7.7% discount to where the stock price trades currently. Remember though, that this is just an approximate valuation, and like any complex formula - garbage in, garbage out.
The assumptions
The calculation above is very dependent on two assumptions. The first is the discount rate and the other is the cash flows. If you don't agree with these result, have a go at the calculation yourself and play with the assumptions. The DCF also does not consider the possible cyclicality of an industry, or a company's future capital requirements, so it does not give a full picture of a company's potential performance. Given that we are looking at Solaris Oilfield Infrastructure as potential shareholders, the cost of equity is used as the discount rate, rather than the cost of capital (or weighted average cost of capital, WACC) which accounts for debt. In this calculation we've used 10%, which is based on a levered beta of 1.295. Beta is a measure of a stock's volatility, compared to the market as a whole. We get our beta from the industry average beta of globally comparable companies, with an imposed limit between 0.8 and 2.0, which is a reasonable range for a stable business.
Moving On:
Although the valuation of a company is important, it is only one of many factors that you need to assess for a company. It's not possible to obtain a foolproof valuation with a DCF model. Instead the best use for a DCF model is to test certain assumptions and theories to see if they would lead to the company being undervalued or overvalued. For instance, if the terminal value growth rate is adjusted slightly, it can dramatically alter the overall result. For Solaris Oilfield Infrastructure, we've compiled three fundamental elements you should further research:
Risks: Be aware that Solaris Oilfield Infrastructure is showing 4 warning signs in our investment analysis , and 1 of those doesn't sit too well with us...
Future Earnings: How does SOI's growth rate compare to its peers and the wider market? Dig deeper into the analyst consensus number for the upcoming years by interacting with our free analyst growth expectation chart.
Other High Quality Alternatives: Do you like a good all-rounder? Explore our interactive list of high quality stocks to get an idea of what else is out there you may be missing!
PS. Simply Wall St updates its DCF calculation for every American stock every day, so if you want to find the intrinsic value of any other stock just search here.
This article by Simply Wall St is general in nature. It does not constitute a recommendation to buy or sell any stock, and does not take account of your objectives, or your financial situation. We aim to bring you long-term focused analysis driven by fundamental data. Note that our analysis may not factor in the latest price-sensitive company announcements or qualitative material. Simply Wall St has no position in any stocks mentioned.
Have feedback on this article? Concerned about the content? Get in touch with us directly. Alternatively, email editorial-team@simplywallst.com.

