
 Yahoo News
 Manchester United 1999 treble xG breakdown: Newcastle, FA Cup final
20 years on, it remains the greatest single-season achievement in English football’s history. But what would Manchester United’s treble of 1999 look like under a 21st century microscope?
In partnership with StatsBomb, The Independent has analysed three key games in United’s run-in with the hope of offering fresh perspective and insight on an iconic team and a historic achievement.
Now, we look at the FA Cup final victory over Newcastle United: a win which sealed the newly-crowned Premier League champions’ second trophy of the season, just four days before the Champions League final.
Manchester United 2-0 Newcastle United
FA Cup final
22 May 1999
Wembley, London
Match statistics
Click on the images to expand
xG totals
Whereas the semi-final replay against Arsenal was a close run thing, this was much more comfortable.
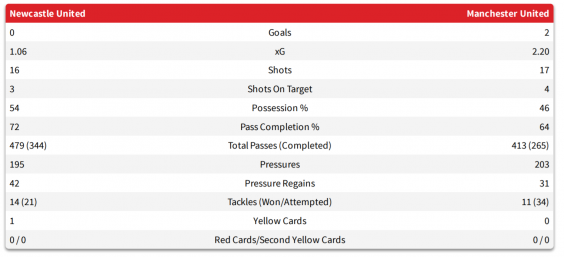
United won 2-0, thanks to two sublime goals from Teddy Sheringham and Paul Scholes. United’s xG was 2.20, while Newcastle was 1.06.
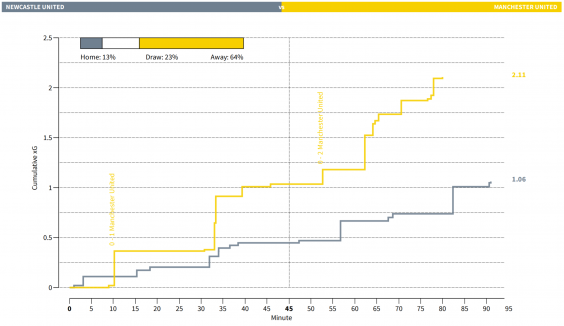
As graphic above shows, United dominated this match. Sir Alex Ferguson’s side were ahead on both the scoreboard and on this cumulative xG plot from Sheringham’s 11th-minute goal onwards.
Though quiet for the remainder of the first half-hour – perhaps adjusting to the early loss of Roy Keane to injury – United kicked on, scored the second through Scholes and steadily saw the victory out.
Shot locations
And yet, for such a comfortable United win, the shot counts are somewhat surprising. Newcastle practically matched their opponents in shot volume – with 16 to United’s 17 and three to their four on target.
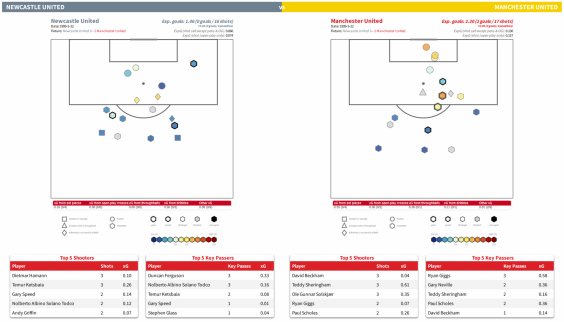
By visualising the quality of those shots, we see a truer reflection of the game. Whereas United have several decent chances inside or just outside the penalty area (shown in yellow/orange), Newcastle have just two.
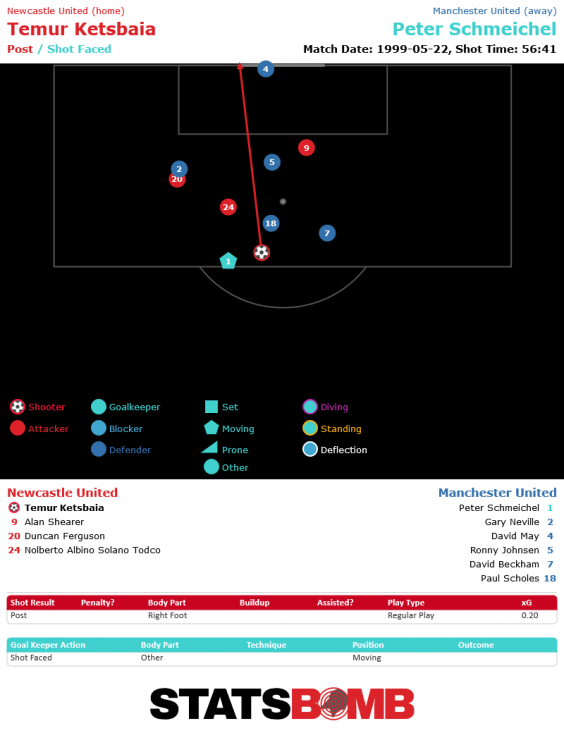
Shortly after Scholes’ goal, Temur Ketsbaia rounded an onrushing Peter Schmeichel. Normally, this would mean a clear-cut chance but United defenders narrowed the gap Ketsbaia had to aim at, making the chance worth just 0.20 xG. He could only hit the post.
Newcastle’s best opportunity came late on and to Silvio Maric, who shifted past David May and bore down one-on-one with Schmeichel. The Croatian, who would score just twice in his time at the club, put a 0.27 xG chance wide.
Otherwise, like Arsenal in the semi-final, Newcastle were limited to shooting from range by a solid and disciplined United defence.
Ketsbaia and Maric’s opportunities were their only decent chances Ruud Gullit’s side created, and they came when United were already 2-0 up.
Sheringham and Scholes’ goals
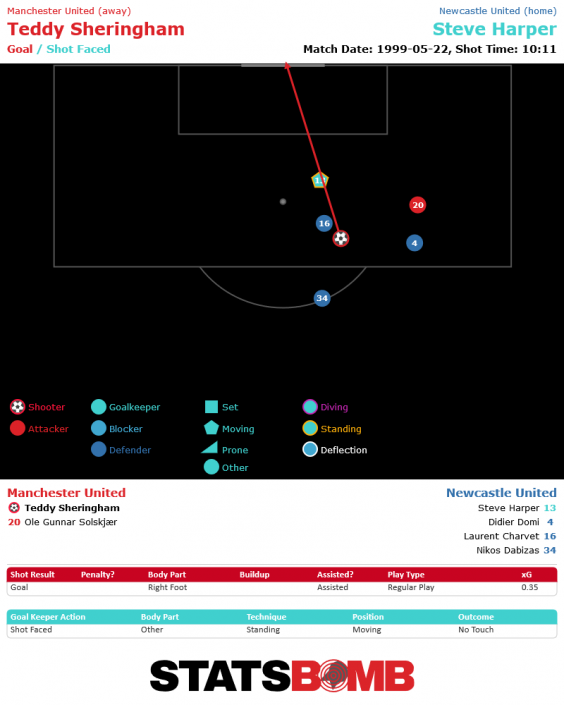
United may have only had one shot more than Newcastle but they were much better at creating good chances. Sheringham scored with their first, firing through Steve Harper’s legs, just moments after replacing Keane.
Harper’s positioning and Laurent Charvet’s attempt to close Sheringham down made the opportunity more difficult than it should have been after Scholes’ brilliant slide pass, but Sheringham finishes the 0.35 xG chance expertly.
United went close to a second through Ole Gunnar Solskjaer’s glancing header in front of a gaping goalmouth (rated as 0.27 xG). Soon after, Andy Cole flicked the ball over Harper (0.36 xG) but it was cleared before it could cross the line.
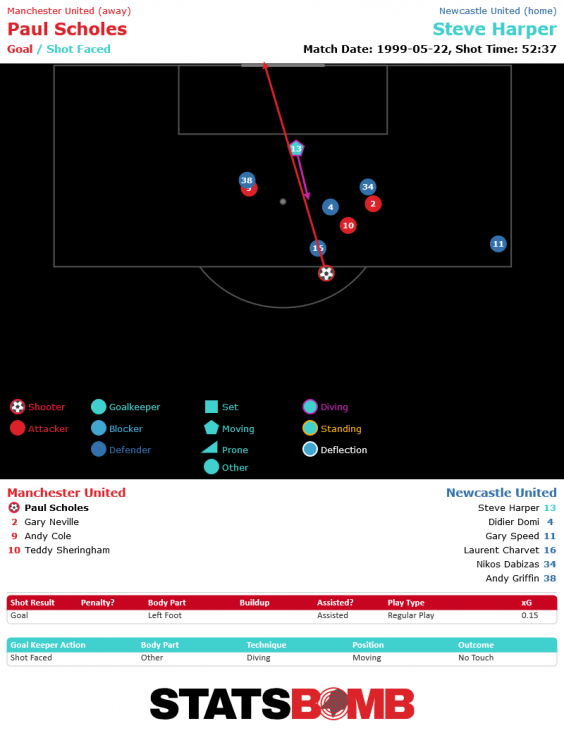
Scholes’ chance was not as favourable as either Solskjaer’s or Cole’s, with Charvet closing him down quickly. Even so, he finds room to squeeze a shot past Harper regardless, converting a chance that would you could expect to score only one in six times.
United’s build-up play
One point which jumps out from the statistics is that United completed just 64% of their passes, which suggests a far more direct style of play than we are now used to seeing from top sides.
For example, 64% is the same figure that Neil Warnock’s relegated Cardiff City managed in the Premier League this season. It was the lowest percentage of any team in the top flight. 2018-19 United’s was around 82%.
A big reason for that change in build-up is that teams are now more willing to play out of the back than in 1999. Schmeichel completes only 27% of his passes in this game, hitting 46 of them long. Centre-halves Ronny Johnsen and David May pass only 25 times combined.
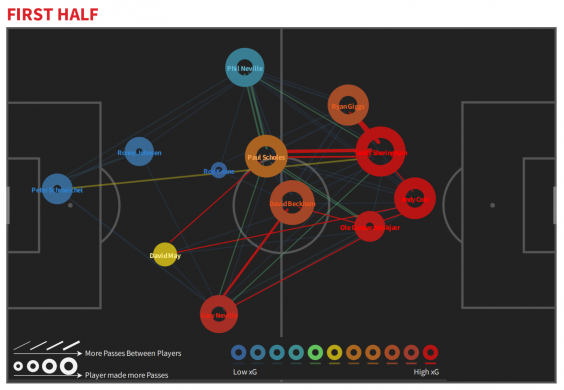
United were a direct team with the ball in their own half. Their strategy, as shown by the passing network graphic above, bypassed the defence and sought to get the ball quickly to the talented forward players.
As the red lines and circles indicating high xG passing combinations show, this is where the slick, quick and imaginative attacking interplay that is associated with Ferguson’s ‘99 treble winners happened.
Sheringham’s importance
Two players happened to be particularly effective against Newcastle. Ryan Giggs does not assist either goal but does well, setting up a good chance for Dwight Yorke and finishing with his side’s highest expected assist (xA) rating.
The other is Sheringham, who finishes the match as United’s most creative force in open play. No United player makes more passes. He plays the ball in the final third more often than any team-mate and takes the most touches inside the box too.
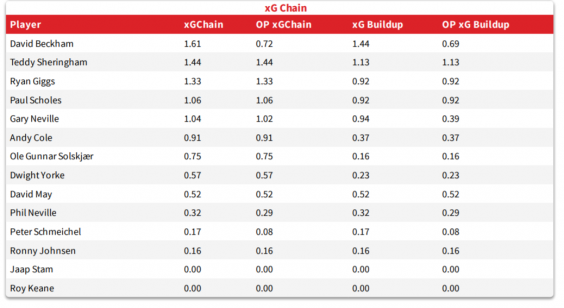
Sheringham contributes to two-thirds of everything his team creates at Wembley, topping StatsBomb’s metrics to measure a player’s build-up contributions in open-play. Only David Beckham – who benefits from being on set-pieces – contributes more overall.
For a player who comes on as a ninth-minute substitute, it is an influential performance. He also scores a goal and registers an assist, of course. In fact, both United strikes are largely of his own making.
For the first, Sheringham dances past two Newcastle defenders, lays the ball off to Scholes and darts towards the penalty area to await the return pass. Though Scholes’ ball should not go without credit, Sheringham makes the opening.
For the second, Solskjaer pounces brilliantly on Nikos Dabizas to regain possession, but it is Sheringham’s delightfully subtle lay-off that tees up Scholes to convert low from the edge of the penalty area.
Perhaps this was a precursor of things to come. Four days later, against Bayern Munich at the Nou Camp, Sheringham and another bit-part striker would have a telling impact off the substitutes’ bench.

StatsBomb is a football analytics company. You can visit their website or follow StatsBomb on Twitter.
Next up: Bayern Munich 1-2 Manchester United, 1999 Champions League final

