
 Yahoo News
 What Is Nabaltec's (ETR:NTG) P/E Ratio After Its Share Price Tanked?

To the annoyance of some shareholders, Nabaltec (ETR:NTG) shares are down a considerable 30% in the last month. That drop has capped off a tough year for shareholders, with the share price down 40% in that time.
All else being equal, a share price drop should make a stock more attractive to potential investors. In the long term, share prices tend to follow earnings per share, but in the short term prices bounce around in response to short term factors (which are not always obvious). The implication here is that long term investors have an opportunity when expectations of a company are too low. One way to gauge market expectations of a stock is to look at its Price to Earnings Ratio (PE Ratio). A high P/E ratio means that investors have a high expectation about future growth, while a low P/E ratio means they have low expectations about future growth.
View our latest analysis for Nabaltec
Does Nabaltec Have A Relatively High Or Low P/E For Its Industry?
Nabaltec's P/E is 13.37. As you can see below Nabaltec has a P/E ratio that is fairly close for the average for the chemicals industry, which is 13.4.
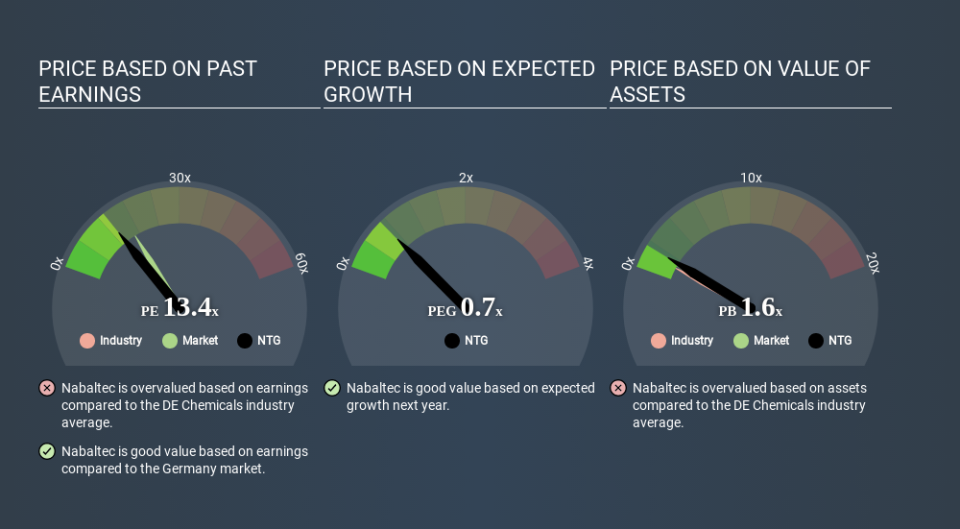
Nabaltec's P/E tells us that market participants think its prospects are roughly in line with its industry. If the company has better than average prospects, then the market might be underestimating it. I would further inform my view by checking insider buying and selling., among other things.
How Growth Rates Impact P/E Ratios
P/E ratios primarily reflect market expectations around earnings growth rates. When earnings grow, the 'E' increases, over time. That means even if the current P/E is high, it will reduce over time if the share price stays flat. Then, a lower P/E should attract more buyers, pushing the share price up.
Nabaltec increased earnings per share by a whopping 25% last year. And its annual EPS growth rate over 5 years is 25%. I'd therefore be a little surprised if its P/E ratio was not relatively high.
A Limitation: P/E Ratios Ignore Debt and Cash In The Bank
Don't forget that the P/E ratio considers market capitalization. That means it doesn't take debt or cash into account. Theoretically, a business can improve its earnings (and produce a lower P/E in the future) by investing in growth. That means taking on debt (or spending its cash).
Such spending might be good or bad, overall, but the key point here is that you need to look at debt to understand the P/E ratio in context.
How Does Nabaltec's Debt Impact Its P/E Ratio?
Net debt totals 20% of Nabaltec's market cap. It would probably deserve a higher P/E ratio if it was net cash, since it would have more options for growth.
The Verdict On Nabaltec's P/E Ratio
Nabaltec trades on a P/E ratio of 13.4, which is below the DE market average of 16.5. The company hasn't stretched its balance sheet, and earnings growth was good last year. If it continues to grow, then the current low P/E may prove to be unjustified. Given Nabaltec's P/E ratio has declined from 19.2 to 13.4 in the last month, we know for sure that the market is significantly less confident about the business today, than it was back then. For those who prefer to invest with the flow of momentum, that might be a bad sign, but for a contrarian, it may signal opportunity.
Investors have an opportunity when market expectations about a stock are wrong. If the reality for a company is not as bad as the P/E ratio indicates, then the share price should increase as the market realizes this. So this free visual report on analyst forecasts could hold the key to an excellent investment decision.
You might be able to find a better buy than Nabaltec. If you want a selection of possible winners, check out this free list of interesting companies that trade on a P/E below 20 (but have proven they can grow earnings).
If you spot an error that warrants correction, please contact the editor at editorial-team@simplywallst.com. This article by Simply Wall St is general in nature. It does not constitute a recommendation to buy or sell any stock, and does not take account of your objectives, or your financial situation. Simply Wall St has no position in the stocks mentioned.
We aim to bring you long-term focused research analysis driven by fundamental data. Note that our analysis may not factor in the latest price-sensitive company announcements or qualitative material. Thank you for reading.

