
 Yahoo News
 Are Neways Electronics International N.V.’s (AMS:NEWAY) High Returns Really That Great?

Today we are going to look at Neways Electronics International N.V. (AMS:NEWAY) to see whether it might be an attractive investment prospect. Specifically, we're going to calculate its Return On Capital Employed (ROCE), in the hopes of getting some insight into the business.
Firstly, we'll go over how we calculate ROCE. Second, we'll look at its ROCE compared to similar companies. Then we'll determine how its current liabilities are affecting its ROCE.
Return On Capital Employed (ROCE): What is it?
ROCE is a measure of a company's yearly pre-tax profit (its return), relative to the capital employed in the business. Generally speaking a higher ROCE is better. In brief, it is a useful tool, but it is not without drawbacks. Renowned investment researcher Michael Mauboussin has suggested that a high ROCE can indicate that 'one dollar invested in the company generates value of more than one dollar'.
How Do You Calculate Return On Capital Employed?
Analysts use this formula to calculate return on capital employed:
Return on Capital Employed = Earnings Before Interest and Tax (EBIT) ÷ (Total Assets - Current Liabilities)
Or for Neways Electronics International:
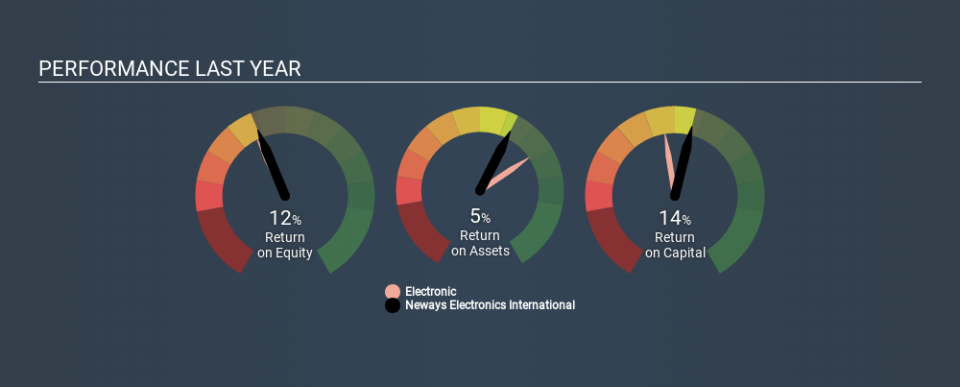
0.14 = €19m ÷ (€291m - €151m) (Based on the trailing twelve months to June 2019.)
So, Neways Electronics International has an ROCE of 14%.
View our latest analysis for Neways Electronics International
Does Neways Electronics International Have A Good ROCE?
One way to assess ROCE is to compare similar companies. In our analysis, Neways Electronics International's ROCE is meaningfully higher than the 11% average in the Electronic industry. We consider this a positive sign, because it suggests it uses capital more efficiently than similar companies. Regardless of where Neways Electronics International sits next to its industry, its ROCE in absolute terms appears satisfactory, and this company could be worth a closer look.
Our data shows that Neways Electronics International currently has an ROCE of 14%, compared to its ROCE of 11% 3 years ago. This makes us think about whether the company has been reinvesting shrewdly. The image below shows how Neways Electronics International's ROCE compares to its industry, and you can click it to see more detail on its past growth.
When considering this metric, keep in mind that it is backwards looking, and not necessarily predictive. ROCE can be deceptive for cyclical businesses, as returns can look incredible in boom times, and terribly low in downturns. This is because ROCE only looks at one year, instead of considering returns across a whole cycle. What happens in the future is pretty important for investors, so we have prepared a free report on analyst forecasts for Neways Electronics International.
Do Neways Electronics International's Current Liabilities Skew Its ROCE?
Short term (or current) liabilities, are things like supplier invoices, overdrafts, or tax bills that need to be paid within 12 months. Due to the way ROCE is calculated, a high level of current liabilities makes a company look as though it has less capital employed, and thus can (sometimes unfairly) boost the ROCE. To check the impact of this, we calculate if a company has high current liabilities relative to its total assets.
Neways Electronics International has current liabilities of €151m and total assets of €291m. As a result, its current liabilities are equal to approximately 52% of its total assets. Neways Electronics International has a relatively high level of current liabilities, boosting its ROCE meaningfully.
The Bottom Line On Neways Electronics International's ROCE
This ROCE is pretty good, but remember that it would look less impressive with fewer current liabilities. Neways Electronics International shapes up well under this analysis, but it is far from the only business delivering excellent numbers . You might also want to check this free collection of companies delivering excellent earnings growth.
If you like to buy stocks alongside management, then you might just love this free list of companies. (Hint: insiders have been buying them).
If you spot an error that warrants correction, please contact the editor at editorial-team@simplywallst.com. This article by Simply Wall St is general in nature. It does not constitute a recommendation to buy or sell any stock, and does not take account of your objectives, or your financial situation. Simply Wall St has no position in the stocks mentioned.
We aim to bring you long-term focused research analysis driven by fundamental data. Note that our analysis may not factor in the latest price-sensitive company announcements or qualitative material. Thank you for reading.
