
 Yahoo News
 NZD/USD Forex Technical Analysis – Close Over .6332 Forms Closing Price Reversal Bottom
The New Zealand Dollar is bouncing back on Friday after reports showed U.S. business activity in both the manufacturing and services sectors stalled in February as companies have grown increasingly concerned about the coronavirus, a survey of purchasing managers showed Friday.
The IHS Markit flash services sector Purchasing Managers’ Index dropped to 49.4 this month, the lowest since October 2013 and signaling that a sector accounting for roughly two-thirds of the U.S. economy was in contraction for the first time since 2016. Economists polled by Reuters had forecast a reading of 53, down slightly from January’s final reading of 53.4.
The services sector new business index dropped to 49.7, the lowest since October 2009, from 52.5 last month. The manufacturing sector barely escaped a slip into contraction, with the flash reading there at 50.8, the lowest since August and down from 51.9 in January. Economists had forecast a reading of 51.5, according to a Reuters poll.
At 17:25 GMT, the NZD/USD is at .6353, up 0.0021 or +0.33%.
Daily Technical Analysis
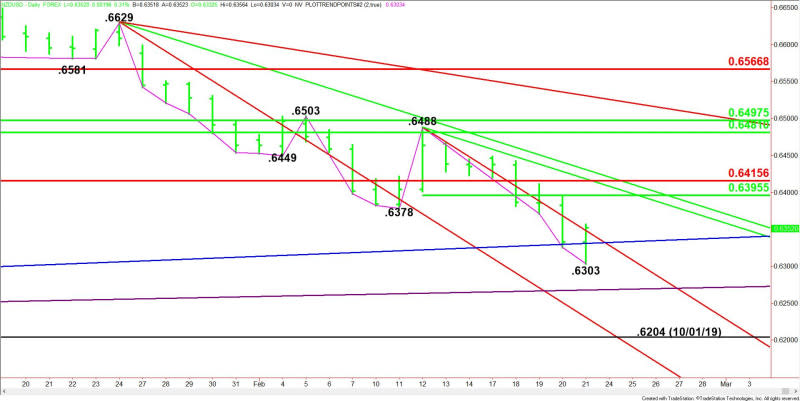
The main trend is down according to the daily swing chart, however, the NZD/USD is currently in a position to post a potentially bullish closing price reversal bottom. This chart pattern won’t change the main trend to up, but it could shift momentum to the upside.
The short-term range is .6488 to .6303. Its retracement zone at .6396 to .6416 is the nearest potential upside target.
Daily Technical Forecast
Based on the early price action and the current price at .6353, the direction of the NZD/USD into the close on Friday is likely to be determined by trader reaction to the downtrending Gann angle at .6348.
Bullish Scenario
A sustained move over .6348 will indicate the presence of buyers. If this move creates enough upside momentum then look for a potential rally into the short-term 50% level at .6396.
Overtaking .6396 will indicate the buying is getting stronger with the next target a price cluster at .6416 to .6418. Since the main trend is down, sellers are likely to come in on a test of this area.
Bearish Scenario
A sustained move under .6348 will signal the presence of sellers. The first downside target is a long-term uptrending Gann angle at .6331. If this angle fails as support then look for a possible retest of today’s intraday low at .6204.
Side Notes
A close over .6332 will form a potentially bullish closing price reversal bottom. If confirmed, this could trigger a 2 to 3 day counter-trend rally. It will not signal a change in trend.
This article was originally posted on FX Empire

