
 Yahoo News
 Is Old Line Bancshares, Inc.'s (NASDAQ:OLBK) High P/E Ratio A Problem For Investors?

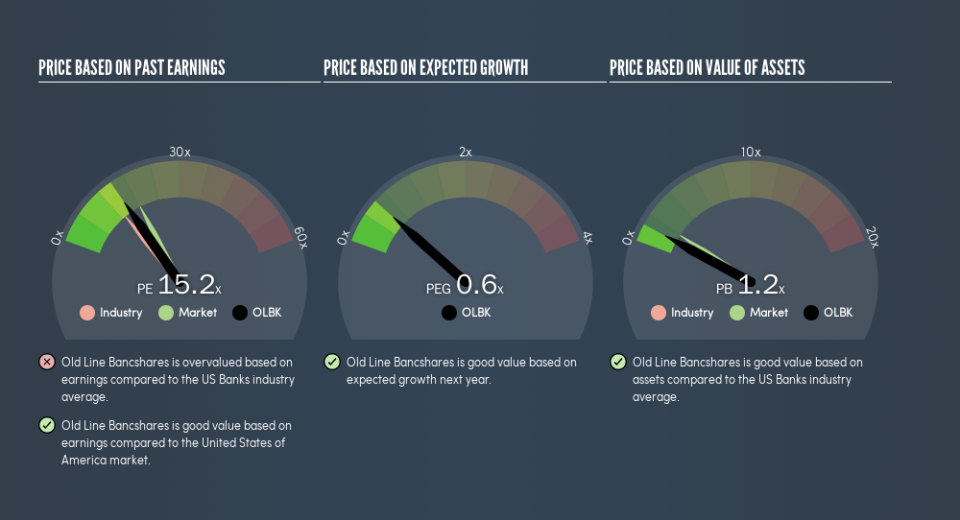
This article is written for those who want to get better at using price to earnings ratios (P/E ratios). We'll show how you can use Old Line Bancshares, Inc.'s (NASDAQ:OLBK) P/E ratio to inform your assessment of the investment opportunity. What is Old Line Bancshares's P/E ratio? Well, based on the last twelve months it is 15.17. That is equivalent to an earnings yield of about 6.6%.
Check out our latest analysis for Old Line Bancshares
How Do You Calculate A P/E Ratio?
The formula for price to earnings is:
Price to Earnings Ratio = Price per Share ÷ Earnings per Share (EPS)
Or for Old Line Bancshares:
P/E of 15.17 = $26.27 ÷ $1.73 (Based on the year to December 2018.)
Is A High Price-to-Earnings Ratio Good?
A higher P/E ratio means that investors are paying a higher price for each $1 of company earnings. That isn't necessarily good or bad, but a high P/E implies relatively high expectations of what a company can achieve in the future.
How Growth Rates Impact P/E Ratios
Earnings growth rates have a big influence on P/E ratios. That's because companies that grow earnings per share quickly will rapidly increase the 'E' in the equation. That means even if the current P/E is high, it will reduce over time if the share price stays flat. Then, a lower P/E should attract more buyers, pushing the share price up.
It's nice to see that Old Line Bancshares grew EPS by a stonking 26% in the last year. And it has bolstered its earnings per share by 15% per year over the last five years. With that performance, I would expect it to have an above average P/E ratio.
Does Old Line Bancshares Have A Relatively High Or Low P/E For Its Industry?
We can get an indication of market expectations by looking at the P/E ratio. You can see in the image below that the average P/E (13.1) for companies in the banks industry is lower than Old Line Bancshares's P/E.
That means that the market expects Old Line Bancshares will outperform other companies in its industry. Shareholders are clearly optimistic, but the future is always uncertain. So further research is always essential. I often monitor director buying and selling.
Remember: P/E Ratios Don't Consider The Balance Sheet
It's important to note that the P/E ratio considers the market capitalization, not the enterprise value. So it won't reflect the advantage of cash, or disadvantage of debt. Theoretically, a business can improve its earnings (and produce a lower P/E in the future) by investing in growth. That means taking on debt (or spending its cash).
While growth expenditure doesn't always pay off, the point is that it is a good option to have; but one that the P/E ratio ignores.
Is Debt Impacting Old Line Bancshares's P/E?
Net debt is 50% of Old Line Bancshares's market cap. While it's worth keeping this in mind, it isn't a worry.
The Verdict On Old Line Bancshares's P/E Ratio
Old Line Bancshares trades on a P/E ratio of 15.2, which is below the US market average of 18.2. The company does have a little debt, and EPS growth was good last year. If it continues to grow, then the current low P/E may prove to be unjustified. Since analysts are predicting growth will continue, one might expect to see a higher P/E so it may be worth looking closer.
Investors have an opportunity when market expectations about a stock are wrong. If it is underestimating a company, investors can make money by buying and holding the shares until the market corrects itself. So this free visualization of the analyst consensus on future earnings could help you make the right decision about whether to buy, sell, or hold.
Of course, you might find a fantastic investment by looking at a few good candidates. So take a peek at this free list of companies with modest (or no) debt, trading on a P/E below 20.
We aim to bring you long-term focused research analysis driven by fundamental data. Note that our analysis may not factor in the latest price-sensitive company announcements or qualitative material.
If you spot an error that warrants correction, please contact the editor at editorial-team@simplywallst.com. This article by Simply Wall St is general in nature. It does not constitute a recommendation to buy or sell any stock, and does not take account of your objectives, or your financial situation. Simply Wall St has no position in the stocks mentioned. Thank you for reading.

