
 Yahoo News
 What Is The Ownership Structure Like For Marston's PLC (LON:MARS)?

A look at the shareholders of Marston's PLC (LON:MARS) can tell us which group is most powerful. Generally speaking, as a company grows, institutions will increase their ownership. Conversely, insiders often decrease their ownership over time. Companies that used to be publicly owned tend to have lower insider ownership.
Marston's is not a large company by global standards. It has a market capitalization of UK£318m, which means it wouldn't have the attention of many institutional investors. In the chart below, we can see that institutions own shares in the company. Let's take a closer look to see what the different types of shareholders can tell us about Marston's.
See our latest analysis for Marston's

What Does The Institutional Ownership Tell Us About Marston's?
Many institutions measure their performance against an index that approximates the local market. So they usually pay more attention to companies that are included in major indices.
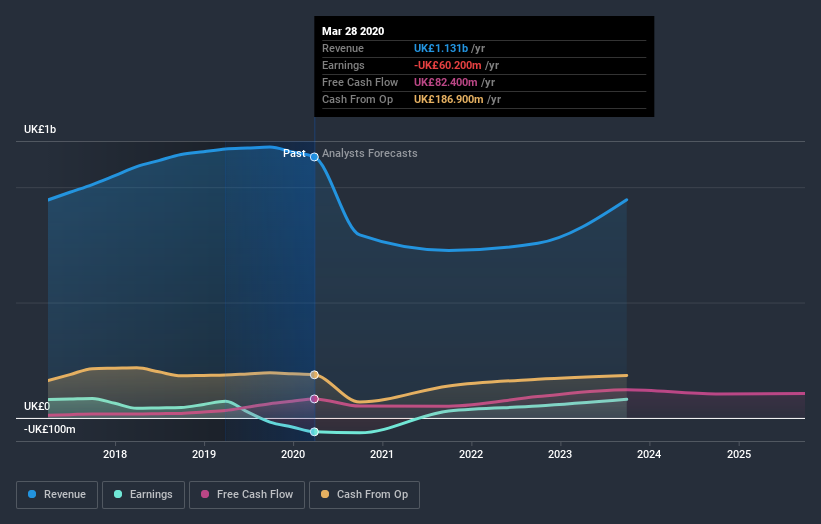
We can see that Marston's does have institutional investors; and they hold a good portion of the company's stock. This suggests some credibility amongst professional investors. But we can't rely on that fact alone since institutions make bad investments sometimes, just like everyone does. If multiple institutions change their view on a stock at the same time, you could see the share price drop fast. It's therefore worth looking at Marston's' earnings history below. Of course, the future is what really matters.
Since institutional investors own more than half the issued stock, the board will likely have to pay attention to their preferences. Hedge funds don't have many shares in Marston's. The company's largest shareholder is HBOS Investment Fund Managers Limited, with ownership of 3.7%. Standard Life Aberdeen plc is the second largest shareholder owning 3.6% of common stock, and The Vanguard Group, Inc. holds about 3.4% of the company stock.
After doing some more digging, we found that the top 24 have the combined ownership of 50% in the company, suggesting that no single shareholder has significant control over the company.
Researching institutional ownership is a good way to gauge and filter a stock's expected performance. The same can be achieved by studying analyst sentiments. There are a reasonable number of analysts covering the stock, so it might be useful to find out their aggregate view on the future.
Insider Ownership Of Marston's
The definition of company insiders can be subjective and does vary between jurisdictions. Our data reflects individual insiders, capturing board members at the very least. Company management run the business, but the CEO will answer to the board, even if he or she is a member of it.
Insider ownership is positive when it signals leadership are thinking like the true owners of the company. However, high insider ownership can also give immense power to a small group within the company. This can be negative in some circumstances.
Our data suggests that insiders own under 1% of Marston's PLC in their own names. It appears that the board holds about UK£965k worth of stock. This compares to a market capitalization of UK£318m. Many investors in smaller companies prefer to see the board more heavily invested. You can click here to see if those insiders have been buying or selling.
General Public Ownership
The general public holds a 30% stake in Marston's. This size of ownership, while considerable, may not be enough to change company policy if the decision is not in sync with other large shareholders.
Next Steps:
While it is well worth considering the different groups that own a company, there are other factors that are even more important. Be aware that Marston's is showing 1 warning sign in our investment analysis , you should know about...
But ultimately it is the future, not the past, that will determine how well the owners of this business will do. Therefore we think it advisable to take a look at this free report showing whether analysts are predicting a brighter future.
NB: Figures in this article are calculated using data from the last twelve months, which refer to the 12-month period ending on the last date of the month the financial statement is dated. This may not be consistent with full year annual report figures.
This article by Simply Wall St is general in nature. It does not constitute a recommendation to buy or sell any stock, and does not take account of your objectives, or your financial situation. We aim to bring you long-term focused analysis driven by fundamental data. Note that our analysis may not factor in the latest price-sensitive company announcements or qualitative material. Simply Wall St has no position in any stocks mentioned.
Have feedback on this article? Concerned about the content? Get in touch with us directly. Alternatively, email editorial-team@simplywallst.com.

