
 Yahoo News
 TransAlta Renewables Inc. (TSE:RNW) Shares Could Be 31% Below Their Intrinsic Value Estimate

Does the August share price for TransAlta Renewables Inc. (TSE:RNW) reflect what it's really worth? Today, we will estimate the stock's intrinsic value by taking the forecast future cash flows of the company and discounting them back to today's value. One way to achieve this is by employing the Discounted Cash Flow (DCF) model. Models like these may appear beyond the comprehension of a lay person, but they're fairly easy to follow.
Companies can be valued in a lot of ways, so we would point out that a DCF is not perfect for every situation. For those who are keen learners of equity analysis, the Simply Wall St analysis model here may be something of interest to you.
View our latest analysis for TransAlta Renewables
Step by step through the calculation
We're using the 2-stage growth model, which simply means we take in account two stages of company's growth. In the initial period the company may have a higher growth rate and the second stage is usually assumed to have a stable growth rate. To start off with, we need to estimate the next ten years of cash flows. Where possible we use analyst estimates, but when these aren't available we extrapolate the previous free cash flow (FCF) from the last estimate or reported value. We assume companies with shrinking free cash flow will slow their rate of shrinkage, and that companies with growing free cash flow will see their growth rate slow, over this period. We do this to reflect that growth tends to slow more in the early years than it does in later years.
A DCF is all about the idea that a dollar in the future is less valuable than a dollar today, so we discount the value of these future cash flows to their estimated value in today's dollars:
10-year free cash flow (FCF) forecast
2021 | 2022 | 2023 | 2024 | 2025 | 2026 | 2027 | 2028 | 2029 | 2030 | |
Levered FCF (CA$, Millions) | CA$321.5m | CA$323.5m | CA$327.0m | CA$316.0m | CA$316.7m | CA$318.7m | CA$321.8m | CA$325.5m | CA$329.8m | CA$334.5m |
Growth Rate Estimate Source | Analyst x2 | Analyst x2 | Analyst x1 | Analyst x1 | Est @ 0.21% | Est @ 0.65% | Est @ 0.95% | Est @ 1.16% | Est @ 1.31% | Est @ 1.42% |
Present Value (CA$, Millions) Discounted @ 6.5% | CA$302 | CA$285 | CA$271 | CA$246 | CA$231 | CA$219 | CA$207 | CA$197 | CA$188 | CA$179 |
("Est" = FCF growth rate estimated by Simply Wall St)
Present Value of 10-year Cash Flow (PVCF) = CA$2.3b
We now need to calculate the Terminal Value, which accounts for all the future cash flows after this ten year period. The Gordon Growth formula is used to calculate Terminal Value at a future annual growth rate equal to the 5-year average of the 10-year government bond yield of 1.7%. We discount the terminal cash flows to today's value at a cost of equity of 6.5%.
Terminal Value (TV)= FCF2030 × (1 + g) ÷ (r – g) = CA$334m× (1 + 1.7%) ÷ (6.5%– 1.7%) = CA$7.1b
Present Value of Terminal Value (PVTV)= TV / (1 + r)10= CA$7.1b÷ ( 1 + 6.5%)10= CA$3.8b
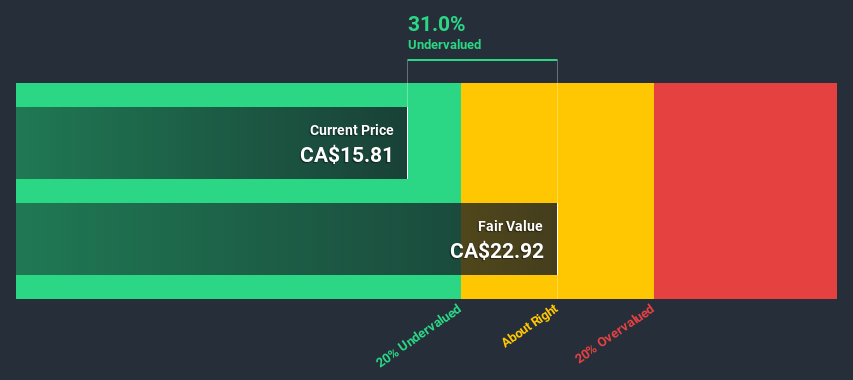
The total value is the sum of cash flows for the next ten years plus the discounted terminal value, which results in the Total Equity Value, which in this case is CA$6.1b. In the final step we divide the equity value by the number of shares outstanding. Relative to the current share price of CA$15.8, the company appears quite undervalued at a 31% discount to where the stock price trades currently. Remember though, that this is just an approximate valuation, and like any complex formula - garbage in, garbage out.
The assumptions
Now the most important inputs to a discounted cash flow are the discount rate, and of course, the actual cash flows. If you don't agree with these result, have a go at the calculation yourself and play with the assumptions. The DCF also does not consider the possible cyclicality of an industry, or a company's future capital requirements, so it does not give a full picture of a company's potential performance. Given that we are looking at TransAlta Renewables as potential shareholders, the cost of equity is used as the discount rate, rather than the cost of capital (or weighted average cost of capital, WACC) which accounts for debt. In this calculation we've used 6.5%, which is based on a levered beta of 0.800. Beta is a measure of a stock's volatility, compared to the market as a whole. We get our beta from the industry average beta of globally comparable companies, with an imposed limit between 0.8 and 2.0, which is a reasonable range for a stable business.
Next Steps:
Although the valuation of a company is important, it shouldn't be the only metric you look at when researching a company. The DCF model is not a perfect stock valuation tool. Rather it should be seen as a guide to "what assumptions need to be true for this stock to be under/overvalued?" For instance, if the terminal value growth rate is adjusted slightly, it can dramatically alter the overall result. Why is the intrinsic value higher than the current share price? For TransAlta Renewables, we've compiled three additional elements you should further examine:
Risks: Consider for instance, the ever-present spectre of investment risk. We've identified 2 warning signs with TransAlta Renewables (at least 1 which is concerning) , and understanding these should be part of your investment process.
Future Earnings: How does RNW's growth rate compare to its peers and the wider market? Dig deeper into the analyst consensus number for the upcoming years by interacting with our free analyst growth expectation chart.
Other Solid Businesses: Low debt, high returns on equity and good past performance are fundamental to a strong business. Why not explore our interactive list of stocks with solid business fundamentals to see if there are other companies you may not have considered!
PS. The Simply Wall St app conducts a discounted cash flow valuation for every stock on the TSX every day. If you want to find the calculation for other stocks just search here.
This article by Simply Wall St is general in nature. It does not constitute a recommendation to buy or sell any stock, and does not take account of your objectives, or your financial situation. We aim to bring you long-term focused analysis driven by fundamental data. Note that our analysis may not factor in the latest price-sensitive company announcements or qualitative material. Simply Wall St has no position in any stocks mentioned.
Have feedback on this article? Concerned about the content? Get in touch with us directly. Alternatively, email editorial-team@simplywallst.com.

