
 Yahoo News
 Is Valmet Oyj’s (HEL:VALMT) 18% ROCE Any Good?

Today we are going to look at Valmet Oyj (HEL:VALMT) to see whether it might be an attractive investment prospect. In particular, we'll consider its Return On Capital Employed (ROCE), as that can give us insight into how profitably the company is able to employ capital in its business.
First up, we'll look at what ROCE is and how we calculate it. Then we'll compare its ROCE to similar companies. Last but not least, we'll look at what impact its current liabilities have on its ROCE.
Return On Capital Employed (ROCE): What is it?
ROCE measures the 'return' (pre-tax profit) a company generates from capital employed in its business. In general, businesses with a higher ROCE are usually better quality. Overall, it is a valuable metric that has its flaws. Renowned investment researcher Michael Mauboussin has suggested that a high ROCE can indicate that 'one dollar invested in the company generates value of more than one dollar'.
How Do You Calculate Return On Capital Employed?
Analysts use this formula to calculate return on capital employed:
Return on Capital Employed = Earnings Before Interest and Tax (EBIT) ÷ (Total Assets - Current Liabilities)
Or for Valmet Oyj:
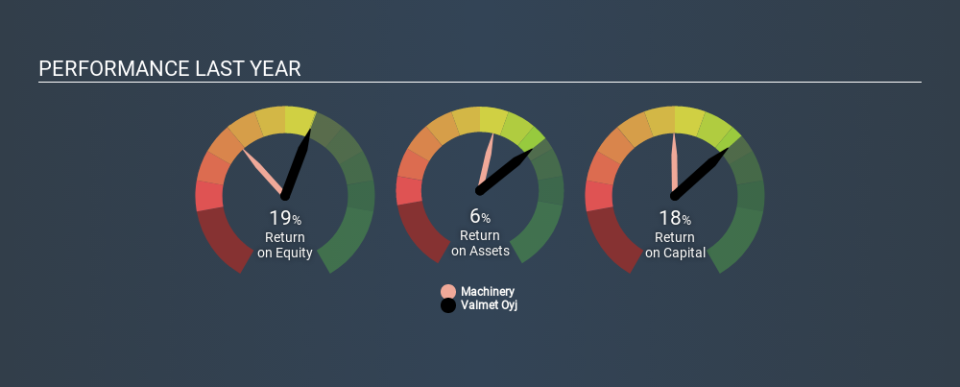
0.18 = €273m ÷ (€3.5b - €1.9b) (Based on the trailing twelve months to December 2019.)
So, Valmet Oyj has an ROCE of 18%.
See our latest analysis for Valmet Oyj
Does Valmet Oyj Have A Good ROCE?
ROCE is commonly used for comparing the performance of similar businesses. In our analysis, Valmet Oyj's ROCE is meaningfully higher than the 10% average in the Machinery industry. We would consider this a positive, as it suggests it is using capital more effectively than other similar companies. Regardless of where Valmet Oyj sits next to its industry, its ROCE in absolute terms appears satisfactory, and this company could be worth a closer look.
In our analysis, Valmet Oyj's ROCE appears to be 18%, compared to 3 years ago, when its ROCE was 12%. This makes us wonder if the company is improving. You can click on the image below to see (in greater detail) how Valmet Oyj's past growth compares to other companies.
It is important to remember that ROCE shows past performance, and is not necessarily predictive. Companies in cyclical industries can be difficult to understand using ROCE, as returns typically look high during boom times, and low during busts. ROCE is, after all, simply a snap shot of a single year. Future performance is what matters, and you can see analyst predictions in our free report on analyst forecasts for the company.
Valmet Oyj's Current Liabilities And Their Impact On Its ROCE
Liabilities, such as supplier bills and bank overdrafts, are referred to as current liabilities if they need to be paid within 12 months. The ROCE equation subtracts current liabilities from capital employed, so a company with a lot of current liabilities appears to have less capital employed, and a higher ROCE than otherwise. To counteract this, we check if a company has high current liabilities, relative to its total assets.
Valmet Oyj has total assets of €3.5b and current liabilities of €1.9b. As a result, its current liabilities are equal to approximately 55% of its total assets. Valmet Oyj's current liabilities are fairly high, which increases its ROCE significantly.
What We Can Learn From Valmet Oyj's ROCE
This ROCE is pretty good, but remember that it would look less impressive with fewer current liabilities. Valmet Oyj shapes up well under this analysis, but it is far from the only business delivering excellent numbers . You might also want to check this free collection of companies delivering excellent earnings growth.
If you are like me, then you will not want to miss this free list of growing companies that insiders are buying.
If you spot an error that warrants correction, please contact the editor at editorial-team@simplywallst.com. This article by Simply Wall St is general in nature. It does not constitute a recommendation to buy or sell any stock, and does not take account of your objectives, or your financial situation. Simply Wall St has no position in the stocks mentioned.
We aim to bring you long-term focused research analysis driven by fundamental data. Note that our analysis may not factor in the latest price-sensitive company announcements or qualitative material. Thank you for reading.
