
 Yahoo News
 Want To Invest In L'Oréal S.A. (EPA:OR)? Here's How It Performed Lately

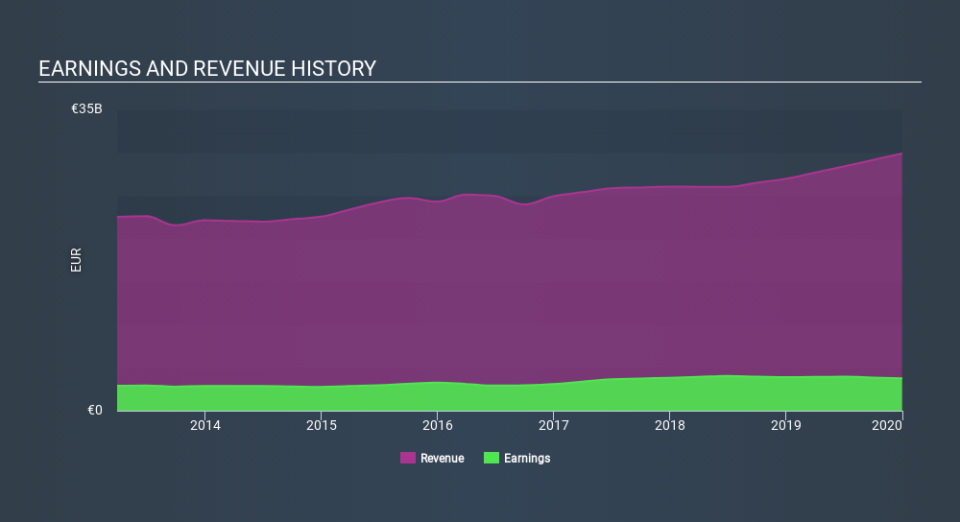
When L'Oréal S.A.'s (ENXTPA:OR) announced its latest earnings (31 December 2019), I wanted to understand how these figures stacked up against its past performance. The two benchmarks I used were L'Oréal's average earnings over the past couple of years, and its industry performance. These are useful yardsticks to help me gauge whether or not OR actually performed well. Below is a quick commentary on how I see OR has performed.
View our latest analysis for L'Oréal
Despite a decline, did OR underperform the long-term trend and the industry?
OR's trailing twelve-month earnings (from 31 December 2019) of €3.8b has declined by -3.7% compared to the previous year.
Furthermore, this one-year growth rate has been lower than its average earnings growth rate over the past 5 years of 7.4%, indicating the rate at which OR is growing has slowed down. Why could this be happening? Let's examine what's occurring with margins and whether the rest of the industry is facing the same headwind.
In terms of returns from investment, L'Oréal has fallen short of achieving a 20% return on equity (ROE), recording 13% instead. However, its return on assets (ROA) of 7.8% exceeds the FR Personal Products industry of 5.6%, indicating L'Oréal has used its assets more efficiently. Though, its return on capital (ROC), which also accounts for L'Oréal’s debt level, has declined over the past 3 years from 17% to 17%.
What does this mean?
L'Oréal's track record can be a valuable insight into its earnings performance, but it certainly doesn't tell the whole story. Companies that are profitable, but have capricious earnings, can have many factors impacting its business. I suggest you continue to research L'Oréal to get a better picture of the stock by looking at:
Future Outlook: What are well-informed industry analysts predicting for OR’s future growth? Take a look at our free research report of analyst consensus for OR’s outlook.
Financial Health: Are OR’s operations financially sustainable? Balance sheets can be hard to analyze, which is why we’ve done it for you. Check out our financial health checks here.
Other High-Performing Stocks: Are there other stocks that provide better prospects with proven track records? Explore our free list of these great stocks here.
NB: Figures in this article are calculated using data from the trailing twelve months from 31 December 2019. This may not be consistent with full year annual report figures.
If you spot an error that warrants correction, please contact the editor at editorial-team@simplywallst.com. This article by Simply Wall St is general in nature. It does not constitute a recommendation to buy or sell any stock, and does not take account of your objectives, or your financial situation. Simply Wall St has no position in the stocks mentioned.
We aim to bring you long-term focused research analysis driven by fundamental data. Note that our analysis may not factor in the latest price-sensitive company announcements or qualitative material. Thank you for reading.

