
 Yahoo News
 Why Capital City Bank Group, Inc.'s (NASDAQ:CCBG) High P/E Ratio Isn't Necessarily A Bad Thing

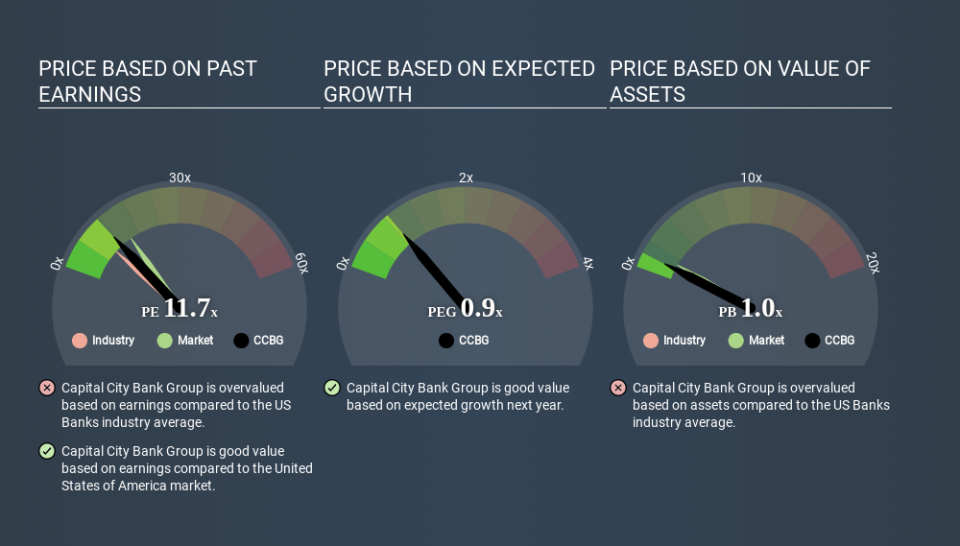
This article is written for those who want to get better at using price to earnings ratios (P/E ratios). We'll show how you can use Capital City Bank Group, Inc.'s (NASDAQ:CCBG) P/E ratio to inform your assessment of the investment opportunity. What is Capital City Bank Group's P/E ratio? Well, based on the last twelve months it is 11.69. In other words, at today's prices, investors are paying $11.69 for every $1 in prior year profit.
See our latest analysis for Capital City Bank Group
How Do I Calculate A Price To Earnings Ratio?
The formula for P/E is:
Price to Earnings Ratio = Price per Share ÷ Earnings per Share (EPS)
Or for Capital City Bank Group:
P/E of 11.69 = $19.980 ÷ $1.709 (Based on the trailing twelve months to March 2020.)
(Note: the above calculation results may not be precise due to rounding.)
Is A High Price-to-Earnings Ratio Good?
A higher P/E ratio means that buyers have to pay a higher price for each $1 the company has earned over the last year. That isn't a good or a bad thing on its own, but a high P/E means that buyers have a higher opinion of the business's prospects, relative to stocks with a lower P/E.
Does Capital City Bank Group Have A Relatively High Or Low P/E For Its Industry?
The P/E ratio indicates whether the market has higher or lower expectations of a company. As you can see below, Capital City Bank Group has a higher P/E than the average company (9.4) in the banks industry.
Its relatively high P/E ratio indicates that Capital City Bank Group shareholders think it will perform better than other companies in its industry classification. Clearly the market expects growth, but it isn't guaranteed. So further research is always essential. I often monitor director buying and selling.
How Growth Rates Impact P/E Ratios
P/E ratios primarily reflect market expectations around earnings growth rates. When earnings grow, the 'E' increases, over time. That means unless the share price increases, the P/E will reduce in a few years. A lower P/E should indicate the stock is cheap relative to others -- and that may attract buyers.
Capital City Bank Group increased earnings per share by 7.8% last year. And its annual EPS growth rate over 5 years is 36%.
Remember: P/E Ratios Don't Consider The Balance Sheet
It's important to note that the P/E ratio considers the market capitalization, not the enterprise value. That means it doesn't take debt or cash into account. Theoretically, a business can improve its earnings (and produce a lower P/E in the future) by investing in growth. That means taking on debt (or spending its cash).
Such expenditure might be good or bad, in the long term, but the point here is that the balance sheet is not reflected by this ratio.
So What Does Capital City Bank Group's Balance Sheet Tell Us?
With net cash of US$132m, Capital City Bank Group has a very strong balance sheet, which may be important for its business. Having said that, at 39% of its market capitalization the cash hoard would contribute towards a higher P/E ratio.
The Verdict On Capital City Bank Group's P/E Ratio
Capital City Bank Group's P/E is 11.7 which is below average (15.1) in the US market. Earnings improved over the last year. Also positive, the relatively strong balance sheet will allow for investment in growth. In contrast, the P/E indicates shareholders doubt that will happen!
Investors should be looking to buy stocks that the market is wrong about. If the reality for a company is not as bad as the P/E ratio indicates, then the share price should increase as the market realizes this. So this free report on the analyst consensus forecasts could help you make a master move on this stock.
Of course, you might find a fantastic investment by looking at a few good candidates. So take a peek at this free list of companies with modest (or no) debt, trading on a P/E below 20.
Love or hate this article? Concerned about the content? Get in touch with us directly. Alternatively, email editorial-team@simplywallst.com.
This article by Simply Wall St is general in nature. It does not constitute a recommendation to buy or sell any stock, and does not take account of your objectives, or your financial situation. We aim to bring you long-term focused analysis driven by fundamental data. Note that our analysis may not factor in the latest price-sensitive company announcements or qualitative material. Simply Wall St has no position in any stocks mentioned. Thank you for reading.

