
 Yahoo News
 Why You Should Care About JCurve Solutions Limited’s (ASX:JCS) Low Return On Capital

Today we'll evaluate JCurve Solutions Limited (ASX:JCS) to determine whether it could have potential as an investment idea. Specifically, we'll consider its Return On Capital Employed (ROCE), since that will give us an insight into how efficiently the business can generate profits from the capital it requires.
First up, we'll look at what ROCE is and how we calculate it. Next, we'll compare it to others in its industry. Finally, we'll look at how its current liabilities affect its ROCE.
Understanding Return On Capital Employed (ROCE)
ROCE measures the amount of pre-tax profits a company can generate from the capital employed in its business. All else being equal, a better business will have a higher ROCE. Overall, it is a valuable metric that has its flaws. Author Edwin Whiting says to be careful when comparing the ROCE of different businesses, since 'No two businesses are exactly alike.
How Do You Calculate Return On Capital Employed?
Analysts use this formula to calculate return on capital employed:
Return on Capital Employed = Earnings Before Interest and Tax (EBIT) ÷ (Total Assets - Current Liabilities)
Or for JCurve Solutions:
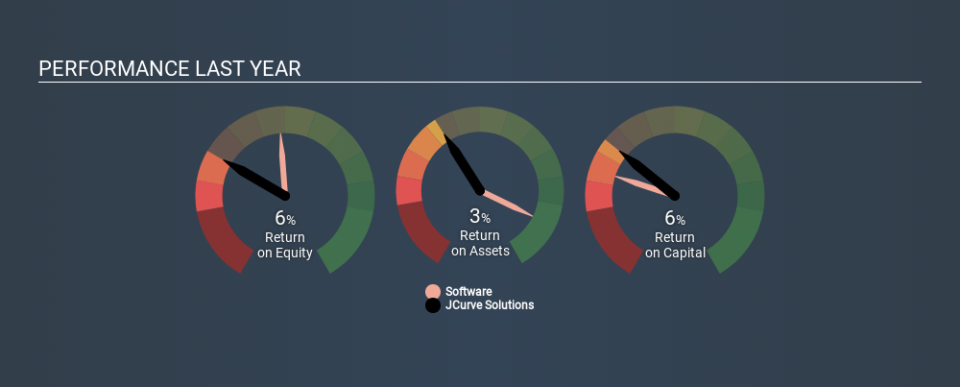
0.059 = AU$388k ÷ (AU$12m - AU$5.7m) (Based on the trailing twelve months to June 2019.)
So, JCurve Solutions has an ROCE of 5.9%.
See our latest analysis for JCurve Solutions
Does JCurve Solutions Have A Good ROCE?
ROCE can be useful when making comparisons, such as between similar companies. In this analysis, JCurve Solutions's ROCE appears meaningfully below the 17% average reported by the Software industry. This performance could be negative if sustained, as it suggests the business may underperform its industry. Setting aside the industry comparison for now, JCurve Solutions's ROCE is mediocre in absolute terms, considering the risk of investing in stocks versus the safety of a bank account. Readers may find more attractive investment prospects elsewhere.
We can see that, JCurve Solutions currently has an ROCE of 5.9% compared to its ROCE 3 years ago, which was 3.4%. This makes us think the business might be improving. You can click on the image below to see (in greater detail) how JCurve Solutions's past growth compares to other companies.
When considering ROCE, bear in mind that it reflects the past and does not necessarily predict the future. ROCE can be misleading for companies in cyclical industries, with returns looking impressive during the boom times, but very weak during the busts. ROCE is, after all, simply a snap shot of a single year. If JCurve Solutions is cyclical, it could make sense to check out this free graph of past earnings, revenue and cash flow.
Do JCurve Solutions's Current Liabilities Skew Its ROCE?
Current liabilities include invoices, such as supplier payments, short-term debt, or a tax bill, that need to be paid within 12 months. Due to the way the ROCE equation works, having large bills due in the near term can make it look as though a company has less capital employed, and thus a higher ROCE than usual. To counteract this, we check if a company has high current liabilities, relative to its total assets.
JCurve Solutions has total liabilities of AU$5.7m and total assets of AU$12m. Therefore its current liabilities are equivalent to approximately 46% of its total assets. JCurve Solutions's ROCE is improved somewhat by its moderate amount of current liabilities.
What We Can Learn From JCurve Solutions's ROCE
With this level of liabilities and a mediocre ROCE, there are potentially better investments out there. You might be able to find a better investment than JCurve Solutions. If you want a selection of possible winners, check out this free list of interesting companies that trade on a P/E below 20 (but have proven they can grow earnings).
For those who like to find winning investments this free list of growing companies with recent insider purchasing, could be just the ticket.
If you spot an error that warrants correction, please contact the editor at editorial-team@simplywallst.com. This article by Simply Wall St is general in nature. It does not constitute a recommendation to buy or sell any stock, and does not take account of your objectives, or your financial situation. Simply Wall St has no position in the stocks mentioned.
We aim to bring you long-term focused research analysis driven by fundamental data. Note that our analysis may not factor in the latest price-sensitive company announcements or qualitative material. Thank you for reading.

