
 Yahoo News
 Why Eumundi Group Limited’s (ASX:EBG) Return On Capital Employed Looks Uninspiring

Today we are going to look at Eumundi Group Limited (ASX:EBG) to see whether it might be an attractive investment prospect. In particular, we'll consider its Return On Capital Employed (ROCE), as that can give us insight into how profitably the company is able to employ capital in its business.
First, we'll go over how we calculate ROCE. Second, we'll look at its ROCE compared to similar companies. Finally, we'll look at how its current liabilities affect its ROCE.
Return On Capital Employed (ROCE): What is it?
ROCE is a metric for evaluating how much pre-tax income (in percentage terms) a company earns on the capital invested in its business. In general, businesses with a higher ROCE are usually better quality. Overall, it is a valuable metric that has its flaws. Renowned investment researcher Michael Mauboussin has suggested that a high ROCE can indicate that 'one dollar invested in the company generates value of more than one dollar'.
So, How Do We Calculate ROCE?
The formula for calculating the return on capital employed is:
Return on Capital Employed = Earnings Before Interest and Tax (EBIT) ÷ (Total Assets - Current Liabilities)
Or for Eumundi Group:
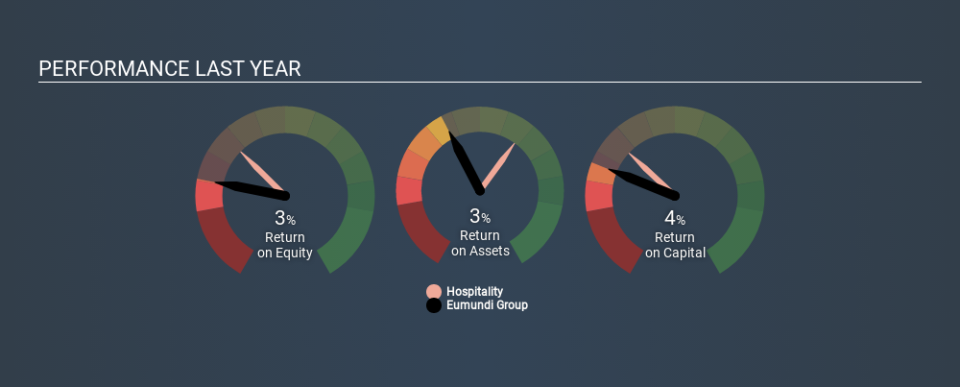
0.038 = AU$2.9m ÷ (AU$78m - AU$3.5m) (Based on the trailing twelve months to December 2019.)
Therefore, Eumundi Group has an ROCE of 3.8%.
See our latest analysis for Eumundi Group
Is Eumundi Group's ROCE Good?
One way to assess ROCE is to compare similar companies. Using our data, Eumundi Group's ROCE appears to be significantly below the 9.2% average in the Hospitality industry. This performance is not ideal, as it suggests the company may not be deploying its capital as effectively as some competitors. Putting aside Eumundi Group's performance relative to its industry, its ROCE in absolute terms is poor - considering the risk of owning stocks compared to government bonds. Readers may wish to look for more rewarding investments.
Eumundi Group's current ROCE of 3.8% is lower than its ROCE in the past, which was 6.4%, 3 years ago. Therefore we wonder if the company is facing new headwinds. You can click on the image below to see (in greater detail) how Eumundi Group's past growth compares to other companies.
When considering this metric, keep in mind that it is backwards looking, and not necessarily predictive. ROCE can be deceptive for cyclical businesses, as returns can look incredible in boom times, and terribly low in downturns. ROCE is, after all, simply a snap shot of a single year. How cyclical is Eumundi Group? You can see for yourself by looking at this free graph of past earnings, revenue and cash flow.
Eumundi Group's Current Liabilities And Their Impact On Its ROCE
Current liabilities are short term bills and invoices that need to be paid in 12 months or less. The ROCE equation subtracts current liabilities from capital employed, so a company with a lot of current liabilities appears to have less capital employed, and a higher ROCE than otherwise. To counteract this, we check if a company has high current liabilities, relative to its total assets.
Eumundi Group has total assets of AU$78m and current liabilities of AU$3.5m. Therefore its current liabilities are equivalent to approximately 4.5% of its total assets. Eumundi Group has very few current liabilities, which have a minimal effect on its already low ROCE.
What We Can Learn From Eumundi Group's ROCE
Nonetheless, there may be better places to invest your capital. Of course, you might find a fantastic investment by looking at a few good candidates. So take a peek at this free list of companies with modest (or no) debt, trading on a P/E below 20.
If you like to buy stocks alongside management, then you might just love this free list of companies. (Hint: insiders have been buying them).
Love or hate this article? Concerned about the content? Get in touch with us directly. Alternatively, email editorial-team@simplywallst.com.
This article by Simply Wall St is general in nature. It does not constitute a recommendation to buy or sell any stock, and does not take account of your objectives, or your financial situation. We aim to bring you long-term focused analysis driven by fundamental data. Note that our analysis may not factor in the latest price-sensitive company announcements or qualitative material. Simply Wall St has no position in any stocks mentioned. Thank you for reading.

