
 Yahoo News
 Should We Worry About Lancashire Holdings Limited's (LON:LRE) P/E Ratio?

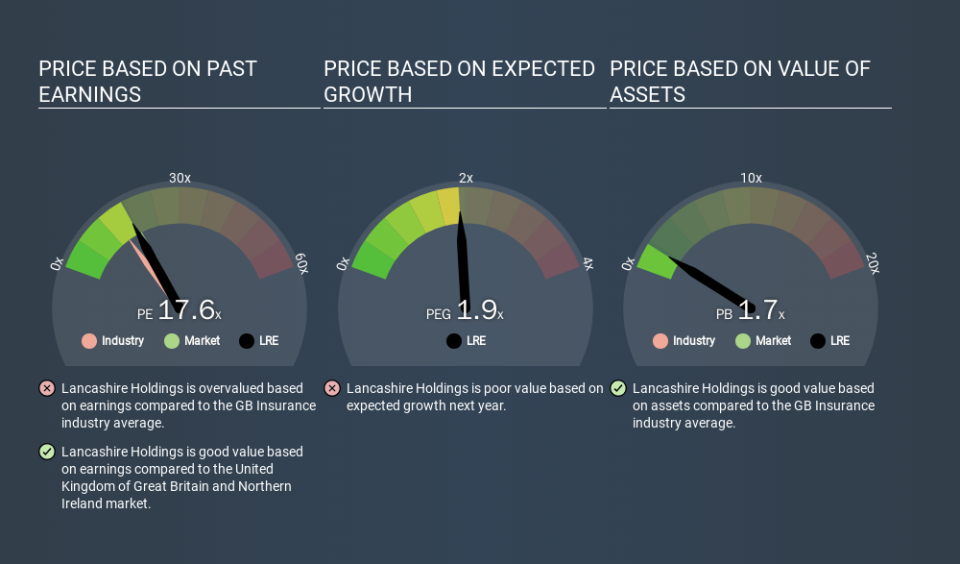
Today, we'll introduce the concept of the P/E ratio for those who are learning about investing. To keep it practical, we'll show how Lancashire Holdings Limited's (LON:LRE) P/E ratio could help you assess the value on offer. Lancashire Holdings has a P/E ratio of 17.63, based on the last twelve months. That corresponds to an earnings yield of approximately 5.7%.
See our latest analysis for Lancashire Holdings
How Do I Calculate A Price To Earnings Ratio?
The formula for price to earnings is:
Price to Earnings Ratio = Share Price (in reporting currency) ÷ Earnings per Share (EPS)
Or for Lancashire Holdings:
P/E of 17.63 = USD10.33 (Note: this is the share price in the reporting currency, namely, USD ) ÷ USD0.59 (Based on the year to December 2019.)
Is A High P/E Ratio Good?
A higher P/E ratio means that buyers have to pay a higher price for each USD1 the company has earned over the last year. That isn't a good or a bad thing on its own, but a high P/E means that buyers have a higher opinion of the business's prospects, relative to stocks with a lower P/E.
How Does Lancashire Holdings's P/E Ratio Compare To Its Peers?
The P/E ratio essentially measures market expectations of a company. As you can see below, Lancashire Holdings has a higher P/E than the average company (14.5) in the insurance industry.
Its relatively high P/E ratio indicates that Lancashire Holdings shareholders think it will perform better than other companies in its industry classification. Clearly the market expects growth, but it isn't guaranteed. So investors should always consider the P/E ratio alongside other factors, such as whether company directors have been buying shares.
How Growth Rates Impact P/E Ratios
If earnings fall then in the future the 'E' will be lower. Therefore, even if you pay a low multiple of earnings now, that multiple will become higher in the future. A higher P/E should indicate the stock is expensive relative to others -- and that may encourage shareholders to sell.
In the last year, Lancashire Holdings grew EPS like Taylor Swift grew her fan base back in 2010; the 213% gain was both fast and well deserved. Unfortunately, earnings per share are down 14% a year, over 5 years.
A Limitation: P/E Ratios Ignore Debt and Cash In The Bank
One drawback of using a P/E ratio is that it considers market capitalization, but not the balance sheet. So it won't reflect the advantage of cash, or disadvantage of debt. In theory, a company can lower its future P/E ratio by using cash or debt to invest in growth.
While growth expenditure doesn't always pay off, the point is that it is a good option to have; but one that the P/E ratio ignores.
How Does Lancashire Holdings's Debt Impact Its P/E Ratio?
Since Lancashire Holdings holds net cash of US$165m, it can spend on growth, justifying a higher P/E ratio than otherwise.
The Verdict On Lancashire Holdings's P/E Ratio
Lancashire Holdings trades on a P/E ratio of 17.6, which is fairly close to the GB market average of 18.5. The excess cash it carries is the gravy on top its fast EPS growth. So based on this analysis we'd expect Lancashire Holdings to have a higher P/E ratio. All the more so, since analysts expect further profit growth. Click here to research this potential opportunity..
When the market is wrong about a stock, it gives savvy investors an opportunity. If the reality for a company is not as bad as the P/E ratio indicates, then the share price should increase as the market realizes this. So this free report on the analyst consensus forecasts could help you make a master move on this stock.
Of course you might be able to find a better stock than Lancashire Holdings. So you may wish to see this free collection of other companies that have grown earnings strongly.
If you spot an error that warrants correction, please contact the editor at editorial-team@simplywallst.com. This article by Simply Wall St is general in nature. It does not constitute a recommendation to buy or sell any stock, and does not take account of your objectives, or your financial situation. Simply Wall St has no position in the stocks mentioned.
We aim to bring you long-term focused research analysis driven by fundamental data. Note that our analysis may not factor in the latest price-sensitive company announcements or qualitative material. Thank you for reading.

