
 Yahoo News
 Ying Hai Group Holdings Company Limited (HKG:8668) Is Employing Capital Very Effectively

Today we'll evaluate Ying Hai Group Holdings Company Limited (HKG:8668) to determine whether it could have potential as an investment idea. In particular, we'll consider its Return On Capital Employed (ROCE), as that can give us insight into how profitably the company is able to employ capital in its business.
First, we'll go over how we calculate ROCE. Then we'll compare its ROCE to similar companies. Last but not least, we'll look at what impact its current liabilities have on its ROCE.
Understanding Return On Capital Employed (ROCE)
ROCE measures the 'return' (pre-tax profit) a company generates from capital employed in its business. All else being equal, a better business will have a higher ROCE. Overall, it is a valuable metric that has its flaws. Author Edwin Whiting says to be careful when comparing the ROCE of different businesses, since 'No two businesses are exactly alike.
How Do You Calculate Return On Capital Employed?
The formula for calculating the return on capital employed is:
Return on Capital Employed = Earnings Before Interest and Tax (EBIT) ÷ (Total Assets - Current Liabilities)
Or for Ying Hai Group Holdings:
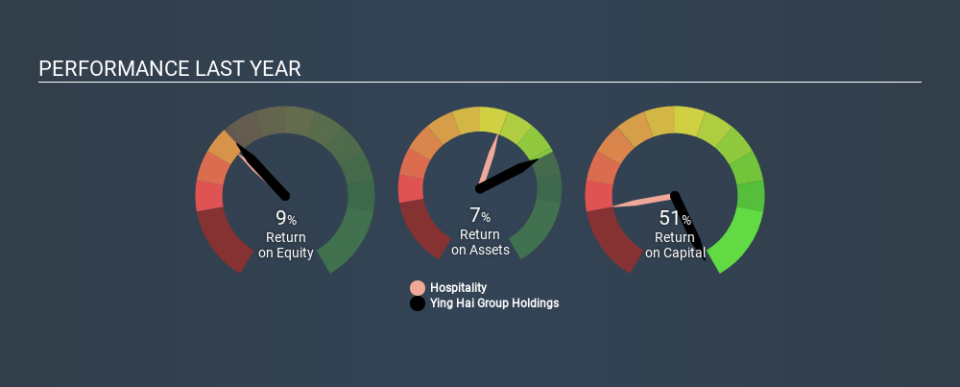
0.51 = HK$23m ÷ (HK$67m - HK$21m) (Based on the trailing twelve months to September 2019.)
Therefore, Ying Hai Group Holdings has an ROCE of 51%.
Check out our latest analysis for Ying Hai Group Holdings
Is Ying Hai Group Holdings's ROCE Good?
When making comparisons between similar businesses, investors may find ROCE useful. Using our data, we find that Ying Hai Group Holdings's ROCE is meaningfully better than the 5.4% average in the Hospitality industry. I think that's good to see, since it implies the company is better than other companies at making the most of its capital. Putting aside its position relative to its industry for now, in absolute terms, Ying Hai Group Holdings's ROCE is currently very good.
You can click on the image below to see (in greater detail) how Ying Hai Group Holdings's past growth compares to other companies.
When considering ROCE, bear in mind that it reflects the past and does not necessarily predict the future. Companies in cyclical industries can be difficult to understand using ROCE, as returns typically look high during boom times, and low during busts. This is because ROCE only looks at one year, instead of considering returns across a whole cycle. If Ying Hai Group Holdings is cyclical, it could make sense to check out this free graph of past earnings, revenue and cash flow.
Do Ying Hai Group Holdings's Current Liabilities Skew Its ROCE?
Liabilities, such as supplier bills and bank overdrafts, are referred to as current liabilities if they need to be paid within 12 months. Due to the way ROCE is calculated, a high level of current liabilities makes a company look as though it has less capital employed, and thus can (sometimes unfairly) boost the ROCE. To counteract this, we check if a company has high current liabilities, relative to its total assets.
Ying Hai Group Holdings has total assets of HK$67m and current liabilities of HK$21m. Therefore its current liabilities are equivalent to approximately 31% of its total assets. Ying Hai Group Holdings's ROCE is boosted somewhat by its middling amount of current liabilities.
What We Can Learn From Ying Hai Group Holdings's ROCE
Despite this, it reports a high ROCE, and may be worth investigating further. Ying Hai Group Holdings shapes up well under this analysis, but it is far from the only business delivering excellent numbers . You might also want to check this free collection of companies delivering excellent earnings growth.
If you are like me, then you will not want to miss this free list of growing companies that insiders are buying.
If you spot an error that warrants correction, please contact the editor at editorial-team@simplywallst.com. This article by Simply Wall St is general in nature. It does not constitute a recommendation to buy or sell any stock, and does not take account of your objectives, or your financial situation. Simply Wall St has no position in the stocks mentioned.
We aim to bring you long-term focused research analysis driven by fundamental data. Note that our analysis may not factor in the latest price-sensitive company announcements or qualitative material. Thank you for reading.

