New 2024 map shows Surrey areas that are cheapest to rent

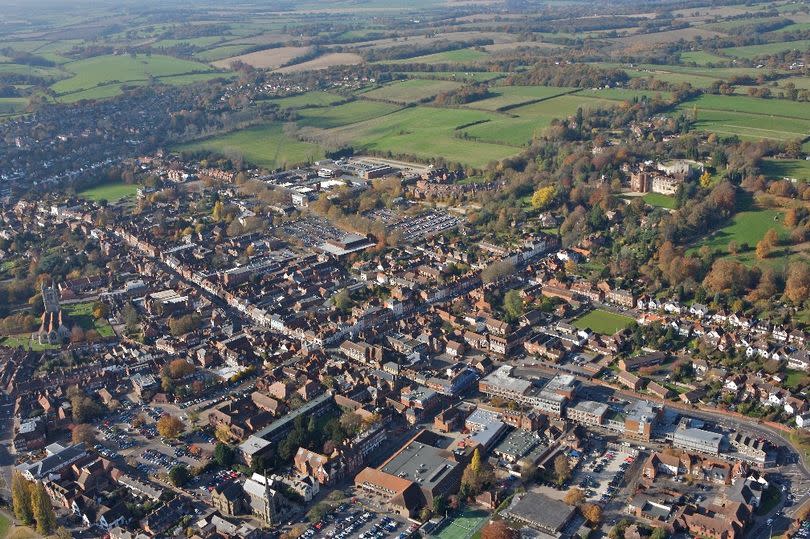
New data has shown the cheapest area to rent in Surrey. Waverley and Surrey Heath are the two most affordable places to rent in the county, and the only places where less than half of people’s wages goes on rent.
It costs £1,337 a month on average to rent a home in Waverley in the year to March 2024, according to the latest figures from the Office for National Statistics.
The average full-time worker in the area earned an estimated £35,771 after tax last year. It means the average rent in the area is 44.9% of the typical take-home pay.
That’s a lower percentage than in any other local authority in Surrey. In Surrey Heath, meanwhile, the average rent was £1,377 a month in the year to March. That works out as 48.5% of the local salary.
No other local authority in our region has rents that make up less than half of the typical take-home pay. Epsom and Ewell, and Guildford are the joint least affordable places to rent, with renting taking up 58.7% of take-home pay on average.
You can see how rent affordability has changed over time in our region as well as in other parts of the country by using our interactive map:
Nationally, people in Great Britain spend more than half of their take-home pay on rent, as wages fail to keep up with soaring prices.
It cost £1,246 a month on average to rent a home in Britain in the year to March 2024.
That’s up by 9.1% compared to the same time last year, and by 34.8% since March 2015, when the average home cost £924 a month to rent.
Meanwhile, the average full-time employee earned an estimated £27,825 last year after tax and national insurance were deducted.
That’s up by 23.1% from 2014, when the average take-home pay was £22,597 for full-time workers.That’s almost 12 percentage points less than rents have increased by in that time.
It means that renting the average British home now costs 53.7% of the typical take-home pay, up from 49.1% back in 2015.
The figures come from exclusive analysis of official earnings and rent price data by the Reach Data Unit.
Take-home pay has been calculated by deducting income tax and national insurance from the median salary in each local authority, for each year from 2014 to 2023.
Bristol has seen the biggest increase of rent unaffordability in the country. The cost of renting in the city has increased at more than twice the rate of full-time salaries.
It costs £1,748 a month to rent the average home in Bristol in the 12 months to March 2024. That’s 64.6% more than in March 2015.
Take-home pay, meanwhile, has increased by 28.2% to an average of £28,288.
It means that renting the average home costs 74.2% of the typical take-home wage, making Bristol one of the least affordable places to rent in the country.
The most unaffordable places to rent are all in London. The average cost of renting a home in Westminster works out as 91.6% of the average take-home pay.
Average rents in Camden account for 85.9% of the average take-home pay. In Hammersmith and Fulham the ratio is 85.3%, in Islington it’s 84.2%, and in Hackney it’s 82.0%.
Dan Wilson Craw, Deputy Chief Executive of Generation Rent, said: “Something has gone very wrong in this country when a home – one of the most basic things we need for a decent life – is becoming more expensive in relation to what we earn. Rent is our biggest cost and if living standards are going to improve it needs to come down. That means building more homes where people want to live, including social housing so that everyone can put a roof over their heads.”
Get more news across Surrey on our homepage here

 Yahoo News
