
 Yahoo News
The charts that show who will decide the outcome of the UK Election 2017


Ever since Theresa May announced that a snap General Election would take place on 8 June, pollsters have scrambled to predict the results.
It’s looking like a foregone conclusion that the Conservatives will emerge victorious, with most predicting a decimation of the Labour party and a landslide victory for Mrs May.
Jeremy Corbyn’s approval rating have plunged to record lows, while The Prime Minister is enjoying strong public backing for her leadership.
MORE: A quarter of Donald Trump’s tweets as president have ‘contained unproven or disputed claims’
MORE: Rabbit set to be world’s biggest dies on United Airlines flight in fresh PR disaster
Some experts estimate that the Tories will nab as many as 56 Labour seats, including in their former heartlands of Wales and the North of England.
But which groups hold the key to the election outcome? The latest number-crunching from YouGov shows us Britain’s new demographic dividing lines, telling us who holds the keys to Number 10.
Class no longer predicts voting intention
Class divides used to run along roughly the same lines as party divides in Britain. But this is no longer the case.
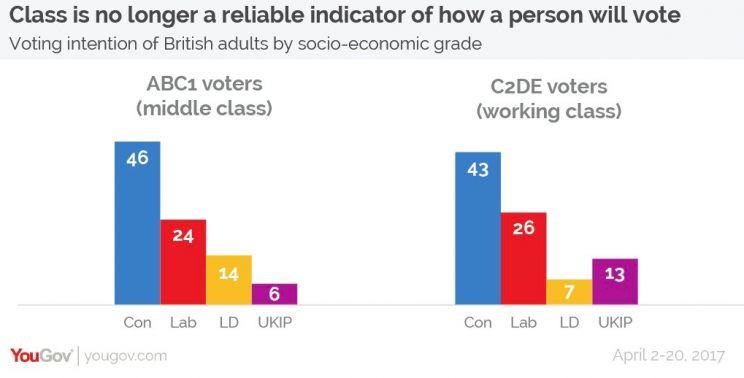
Labour used to be the party of the working classes. In the 1992 election, Labour was ahead by 10 points among C2DE (working class) voters. But as this group abandons Jeremy Corbyn, it is pushing Theresa May further into the lead.
Age is the new dividing line
Want to hazard a guess as to how a person will vote? You’re best off looking at how old they are.
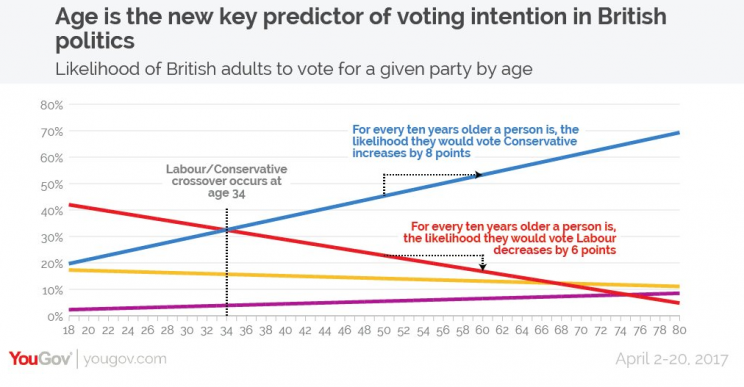
The 18-24 year-old bracket is overwhelmingly more likely to vote Labour – the party is 19% ahead with the age group. On the other hand, the Conservatives are 49% more popular with the over 65s.
There’s a major issue here for Labour – older people are far more likely to turn up to the polling stations. They therefore have more sway in elections, which is good news for Theresa May in 2017.
Education is key for forecasting votes
Education joins age in ousting class as an indicator of voting intention.

The Conservatives lead amongst all educational groups, but every additional qualification makes a person more likely to chose Lib Dem or Labour. Those with no formal qualifications are far more likely go support Mrs May. Ukip in particular struggles to win with educated voters – those with no formal qualifications are four times more likely to vote for the party than those with a degree.
Gender isn’t actually an issue for the Tories

Theresa May’s predecessor David Cameron was described as having a ‘women problem’, and the Conservative Party was seen as traditionally having stronger support among men. But in 2017, women are fractionally more likely to vote Tory – although women under 40 are more strongly in support of Labour. This is cancelled out by over 40s, 53% of women in this age bracket say they would vote for May.
The Conservatives are no longer just the party of the rich
Richer people, specifically those earning more than £70,000, are still more likely the support the Conservatives. But the party has gained much support amongst lower earners.

Labour has lost its mantle as the party of the poor. Their support is higher amongst low earning, but 40% of those pocketing less than £20,000 a year is planning to vote Conservative.

