
 Yahoo News
 How a deluge of lockdown volunteers rescued UK's hidden weather history
When it rains, it pours. Make hay while the sun shines. Save for a rainy day. Come rain or shine. The English language is overflowing with phrases about the weather, especially rain, or the lack of it. Fascination with the weather seems embedded in the UK’s national identity, but there is much people still need to learn about it.
Scientists know there were terrible floods and brutal droughts in the country’s past which could happen again. And as the climate changes, intense downpours in particular are likely to become more common and even more extreme.
The government advises that defences must be able to withstand floods which are so rare that they only occur once every 100 years. What does such a flood look like? We need as much data from the past as possible to accurately describe these events so that homes are properly protected.
Sadly, much of this information is stored in hand-written paper records which amateur meteorologists compiled over centuries. But thanks to the work of modern volunteers, millions of rainfall measurements were recently made available to science, vastly expanding our understanding of Britain’s climate, revealing new records and shedding light on just how extreme the weather can get.
A treasure trove of data
Starting in the 1860s, The British Rainfall Organisation (BRO), led by meteorologist George Symons, collected rainfall observations from around Britain and Ireland by calling on volunteers to send in their records. They dug up measurements from as far back as 1677, from newspapers and other publications, as well as diaries kept by weather enthusiasts.
The BRO collated these observations on 66,000 pieces of paper. Each sheet contained measurements of the rain that fell each month during a particular decade in a particular location.
New rainfall data was immediately stored on computers from 1960 onwards, and the paper sheets were carefully stored in archives where they were largely forgotten. Turning the five million handwritten measurements into digital data a computer can analyse is an enormous task which requires human eyes to recognise the often hard-to-read numbers.

An opportunity arose in early 2020 during the first national lockdown. The National Meteorological Archive had scanned the paper sheets and made the images available online. The University of Reading launched a citizen science project called Rainfall Rescue, asking the public to help make these measurements available to science once more.
Volunteers were shown an image of a single sheet and asked to type the values for a particular year into the website. Each sheet was shown to at least four different volunteers to iron out any mistakes. We estimated the process would take many months. It took just 16 days.
We had not expected 16,000 volunteers to pitch in. Whether it was people with more spare time or those looking for a distraction during the pandemic, the public response was extraordinary. Night and day the data poured in. Some volunteers looked at more than 1,000 pages, and 100 million keystrokes later, the project has yielded more than 3.3 million rainfall measurements taken between 1677 and 1960 from thousands of locations. These are now available online and have been processed by the Met Office to improve the national rainfall statistics.
New weather records
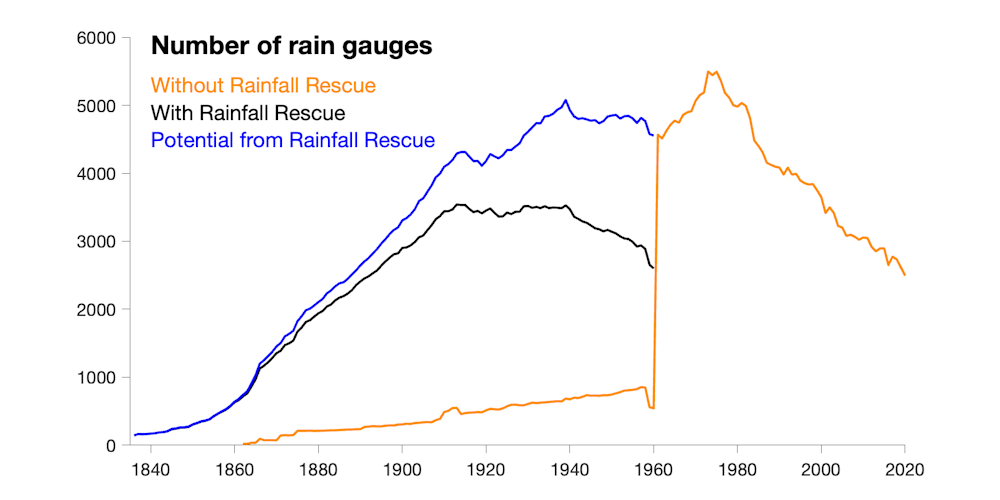
Before Rainfall Rescue began, UK records stretched back to 1862, but only data from 19 rain gauges were available for that year. Thanks to the efforts of volunteers, data from more than 700 rain gauges are now available for 1862, allowing us to map rainfall variation in far greater detail than ever before.
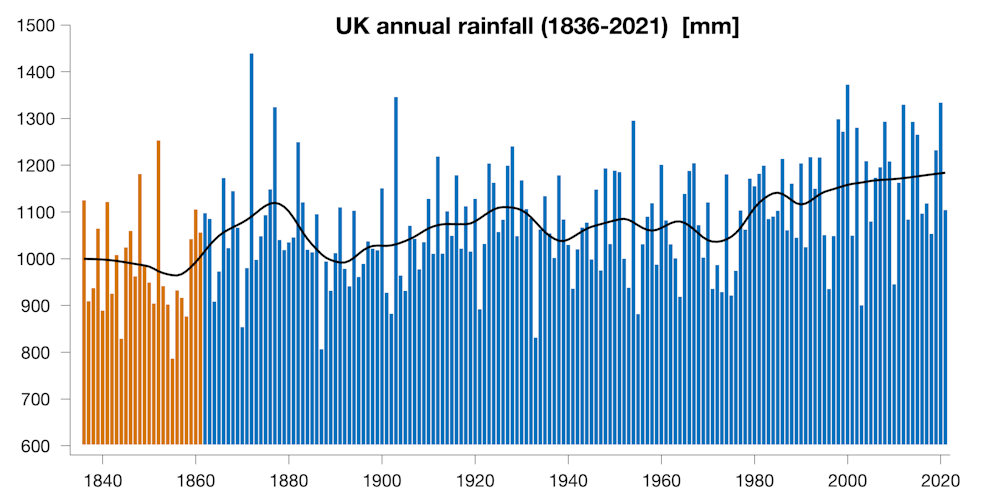
We can also look further back in time and map rainfall across the UK for every month since 1836. This is the year that Charles Darwin returned to the UK on the Beagle with Vice-Admiral Robert Fitzroy (who later set up the Met Office), and is the year before Queen Victoria began her reign.
The data from Rainfall Rescue before 1862 is new to science, and so our records need updating. The driest year on record for the UK used to be 1887. It is now 1855.
February 2020 had been the wettest on record for many regions of the UK, while May was the driest in many places. But those record-breakers have now lost their status. For many regions, February 1848 was wetter than 2020 and, for others, May 1844 was drier than 2020.
Other significant events emerge from the data too. April 1842 is now the driest April on record for the UK. November and December 1852 set records for being extremely wet, with significant flooding across the country.
We’re just beginning to analyse the new data, and still adding information from more locations. This will offer invaluable insight into how the UK’s climate is changing and put recent weather in perspective, preparing us for the future with better understanding of what the weather has thrown at us in the past.
The sheets of paper which made this possible were assembled by an earlier army of volunteers who dedicated themselves to recording rainfall, every day, often for many decades. Lady Bayning took measurements from 1835 to 1887, even bringing her rain gauge as she travelled from Norfolk to London for the social season. William Buckley Pugh contributed 65 years of rainfall observations at his mill near Hull and later in retirement.
Thousands of other people took measurements at waterworks, factories, vicarages, canals, railway stations, lighthouses and hospitals across the length and breadth of Britain and Ireland. Their efforts, the vision of George Symons, and now the time and commitment of thousands of online volunteers have transformed our knowledge of rainfall in these islands.
Don’t have time to read about climate change as much as you’d like?
Get a weekly roundup in your inbox instead. Every Wednesday, The Conversation’s environment editor writes Imagine, a short email that goes a little deeper into just one climate issue. Join the 10,000+ readers who’ve subscribed so far.
This article is republished from The Conversation under a Creative Commons license. Read the original article.

Ed Hawkins receives funding from the National Centre for Atmospheric Science and the Natural Environment Research Council.

