Five key charts you need to see before the November 2017 budget

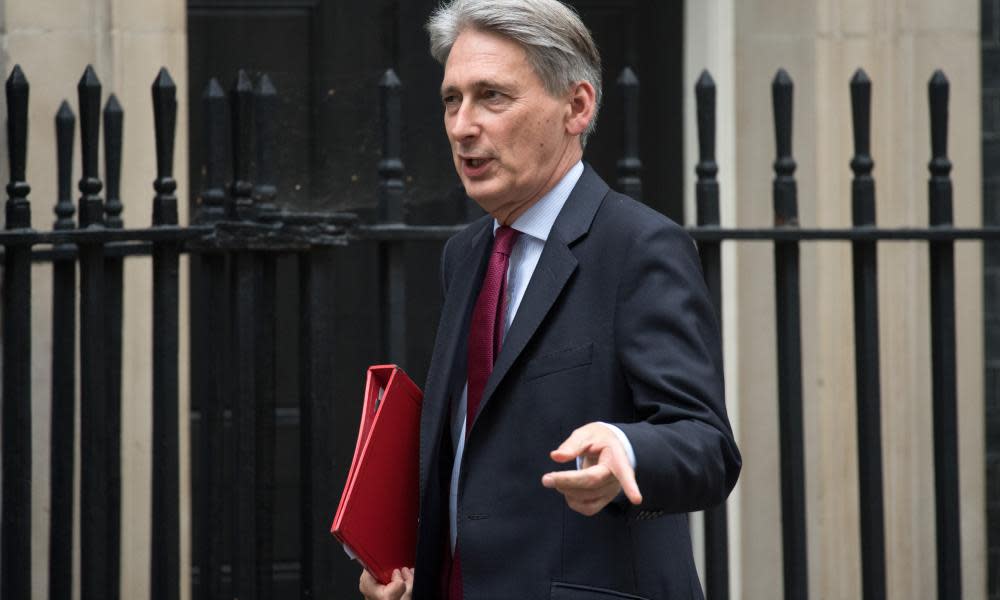
The chancellor, Philip Hammond, will deliver one of the most difficult budgets in recent times, set against a backdrop of weaker growth, Brexit uncertainty and falling living standards.
Here are five key charts to consider before he stands up.
1. The UK is slipping down the G7 leader board as growth slows
Britain was second only to Germany in 2016 in the growth league table of the G7 leading industrial nations. It is a boast the chancellor will not be able to make this time around, as the UK is expected to slip down the leader board in both 2017 and 2018, as Brexit uncertainty weighs on consumers and businesses. The International Monetary Fund is predicting UK growth will slow to 1.7% in 2017 and 1.5% in 2018. Revised forecasts from the government’s independent forecaster, the Office for Budget Responsibility (OBR), are likely to reflect Britain’s weaker growth prospects.
2. Wages are falling in real terms as prices rise faster than pay
Hammond will deliver this budget at a time when family finances are under renewed strain from falling real pay. As the chart above shows, the financial crisis took a heavy toll on UK living standards, as prices roses faster than wage in the six years from 2008. Following a brief respite in 2015 and 2016, falling real pay returned in 2017 as the sharp fall in the value pound drove up the cost of imported goods and fed through to higher inflation. Inflation has risen from 0.5% in June 2016 – the month of the referendum – to 3% in October. Wage growth has failed to keep pace, despite low unemployment, and was 2.2% in September.
3. UK productivity has stalled since the financial crisis
Growth in economic output per hour has stalled in the years since the 2008 crisis. The OBR is expected to downgrade its estimates for productivity growth on Wednesday, with damaging effects for the public finances. Lower growth in the efficiency of workers means weaker economic output in the years to come, leaving less activity for the exchequer to benefit from in the form of taxes. The Institute for Fiscal Studies estimates this will create a £20bn hole in the public finances.
4. Unemployment is the lowest since the 1970s
The chancellor can draw considerable comfort from the lowest unemployment rate since the mid-1970s. Hammond is likely to use the figures to suggest the economy is in good health, despite fears over Brexit. However, the low rate of unemployment appears to have done little to improve the bargaining power of workers to demand higher wages. Meanwhile the latest official data on the labour market contained signs that Britain’s long employment boom might be coming to an end, showing a drop in the number of people in work, a fall in full-time employment, and a decline in number of job vacancies.
5. Borrowing has been lower than expected this year
The budget deficit, which is the shortfall between spending and tax receipts, has come in better than forecast in recent months thanks to rising inflation pushing up the cost of goods – and therefore the taxes taken by the exchequer in the shape of VAT receipts. That could help the Treasury to undershoot official predictions for the annual 2017-18 deficit by about £10bn, coming in closer to £48bn than the official forecast of £58bn for the year. Still, the deficit unexpectedly grew in October, and the OBR is poised to raise its forecasts for government borrowing in the years to come, painting a weaker picture of the public finances than it was previously expecting.

 Yahoo News
