
 Yahoo News
 How the Guardian investigated green space inequality at English schools
Private schools’ grounds and student numbers
The aim was to find out how much green space the UK’s private schools own compared with state schools, as part of the Guardian’s continuing investigations into access to green space.
Given the complexity of the task the decision was taken to restrict the research to what were traditionally known as public schools, using the 350 or so schools with membership of the HMC group as a proxy.
Because HM Land Registry only includes corporate land-holdings in England and Wales and because the figure of green space for state schools only covers England, the list was reduced to English schools only. It was not possible to identify land titles for a small number of schools. The Guardian’s analysis incorporates more than 250 schools in total.
For each of the English HMC schools in our list, the team – including journalists and an editorial-based software developer – searched Land Registry data to find land titles currently owned by the school, and information related to each land title including its address, tenure type, location and boundaries. Each school’s land titles were verified by a second team member.
Where two or more schools shared the same postcode, were located within a 0.5km radius of each other, or shared the same web address, a further check was carried out to ensure that pupils attending sister schools (eg preparatory and junior schools) who were likely to have access to the main school grounds were included in our calculation.
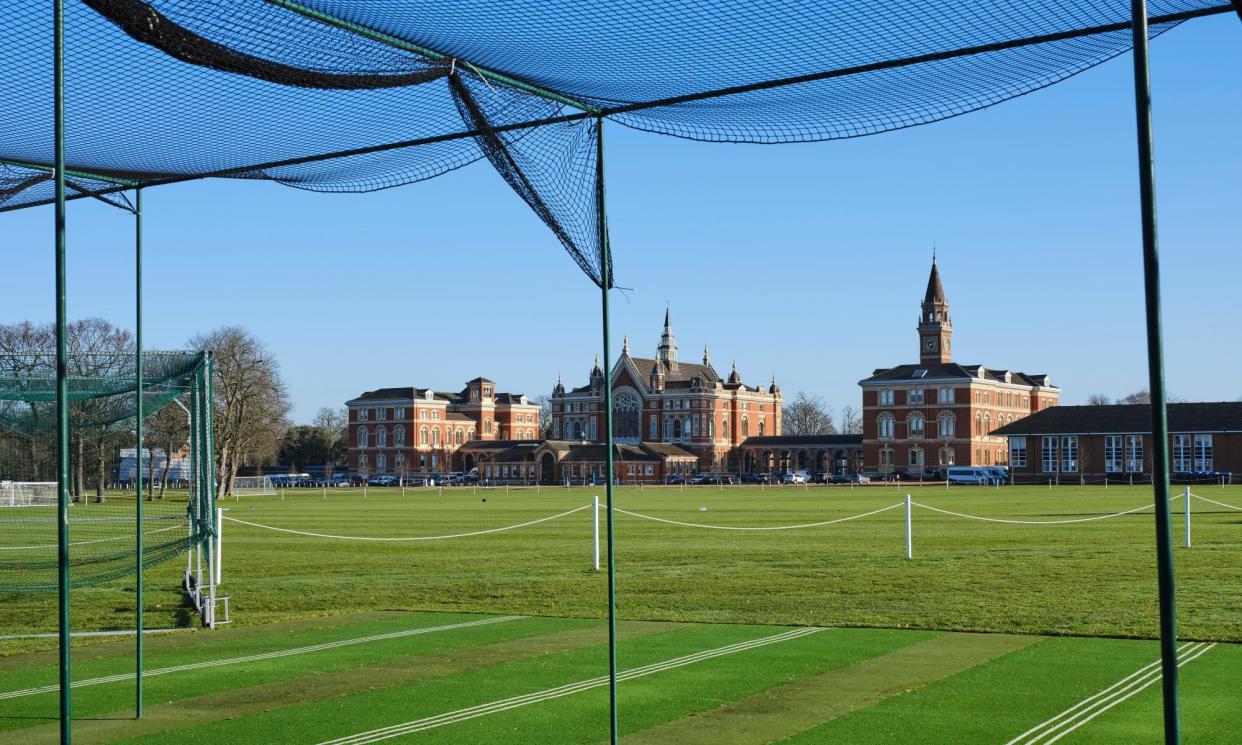
Many of the schools we researched own land that is not used as school grounds or facilities, sometimes far away from their campuses, in some cases in other counties. Winchester College, for example, owns “over 8,000 acres of rural property holdings” but “grounds of approximately 250 acres”.
We approximated each school’s campus (ie the area that pupils have access to) by finding the area of its land-holdings that lie within 5km of the school’s address. It is likely that this method of categorisation includes both false positives (land titles to which students do not have access inside the 5km radius) as well as false negatives (school facilities located more than 5km away) in the overall campus area calculation.
In order to address this in so far as possible the team:
Verified this estimate of campus size of each of the 50 schools with the most land by comparing each school’s land-holdings within a 5km radius to its reported campus size (gathered from school websites and Wikipedia pages, and Ukboardingschools.com).
Wherever our estimate differed from those schools’ estimates by a margin of 15% or more, we used satellite imagery to manually measure the school’s area.
To determine the amount of green space in each school’s campus, we used the UK Center for Ecology & Hydrology’s land cover map 2021. The dataset breaks the land area of Great Britain and Northern Ireland into 10m x 10m segments and classifies each into land cover categories such as “built-up areas’’, “freshwater”, “improved grassland” and “coniferous woodland”.
According to its documentation, in a formal validation exercise the data product was found to have an overall accuracy of “82.6%, with a 95% confidence interval of 82.2%-83%”.
We joined this dataset to vector data for each school’s campus area in order to estimate the proportion and total area of green (non-built-up) space in each campus.
Where schools were part of a group, with land held in common, we went through the groups, chose those schools that belonged to HMC, identified the title deeds that would pertain only to that school, and then carried out the analysis as above.
HMC schools’ pupil numbers were derived from the 2022-23 school census.
State school grounds and student numbers
The Department for Education (DfE) estimates the combined green space area of state schools in England to be 263.3m sq metres, a figure that encompasses woodland and habitat areas, soft landscaping and planted areas, grass areas and excludes paved areas, tarmac surfaces, all-weather pitches and other artificial surfaces and external swimming pools.
In a note the department added that the survey on which these estimates are based does not collect information on the specific usage of land. For example, the grass area will include informal social areas accessible to pupils but also areas that are not directly accessible to pupils (eg grass verges around a car park).
Green space per state pupil was reached by dividing the figure provided by the department by the average number of pupils enrolled in state schools between 2017 and 2021, the period covered by the departmental survey of schools’ land usage, known as the condition data collection programme, which the DfE says represents a “snapshot” of the school estate that continually changes as schools are extended, merged or closed and new schools are opened.

