
 Yahoo News
 Can You Imagine How Jubilant Geodrill's (TSE:GEO) Shareholders Feel About Its 217% Share Price Gain?

The most you can lose on any stock (assuming you don't use leverage) is 100% of your money. But on the bright side, you can make far more than 100% on a really good stock. One great example is Geodrill Limited (TSE:GEO) which saw its share price drive 217% higher over five years. Also pleasing for shareholders was the 22% gain in the last three months.
View our latest analysis for Geodrill
To paraphrase Benjamin Graham: Over the short term the market is a voting machine, but over the long term it's a weighing machine. One way to examine how market sentiment has changed over time is to look at the interaction between a company's share price and its earnings per share (EPS).
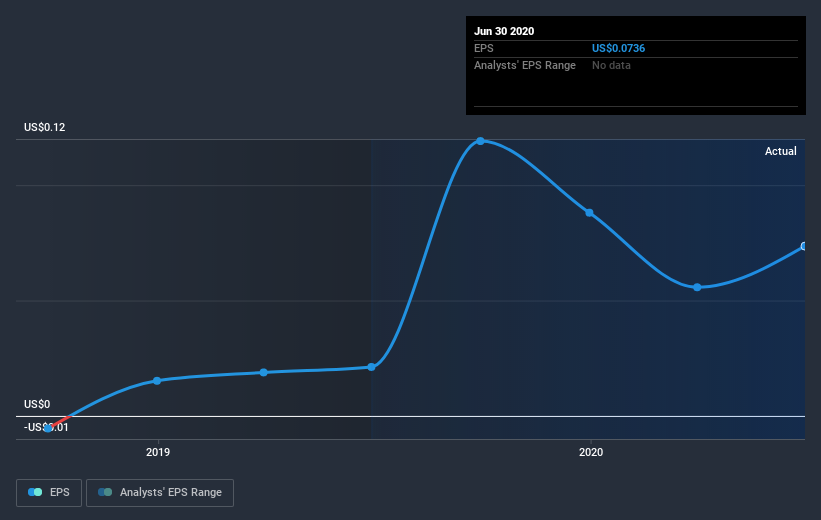
During the five years of share price growth, Geodrill moved from a loss to profitability. That kind of transition can be an inflection point that justifies a strong share price gain, just as we have seen here.
The company's earnings per share (over time) is depicted in the image below (click to see the exact numbers).
We know that Geodrill has improved its bottom line lately, but is it going to grow revenue? You could check out this free report showing analyst revenue forecasts.
A Different Perspective
It's good to see that Geodrill has rewarded shareholders with a total shareholder return of 25% in the last twelve months. Having said that, the five-year TSR of 26% a year, is even better. I find it very interesting to look at share price over the long term as a proxy for business performance. But to truly gain insight, we need to consider other information, too. For example, we've discovered 1 warning sign for Geodrill that you should be aware of before investing here.
Of course, you might find a fantastic investment by looking elsewhere. So take a peek at this free list of companies we expect will grow earnings.
Please note, the market returns quoted in this article reflect the market weighted average returns of stocks that currently trade on CA exchanges.
This article by Simply Wall St is general in nature. It does not constitute a recommendation to buy or sell any stock, and does not take account of your objectives, or your financial situation. We aim to bring you long-term focused analysis driven by fundamental data. Note that our analysis may not factor in the latest price-sensitive company announcements or qualitative material. Simply Wall St has no position in any stocks mentioned.
Have feedback on this article? Concerned about the content? Get in touch with us directly. Alternatively, email editorial-team@simplywallst.com.

