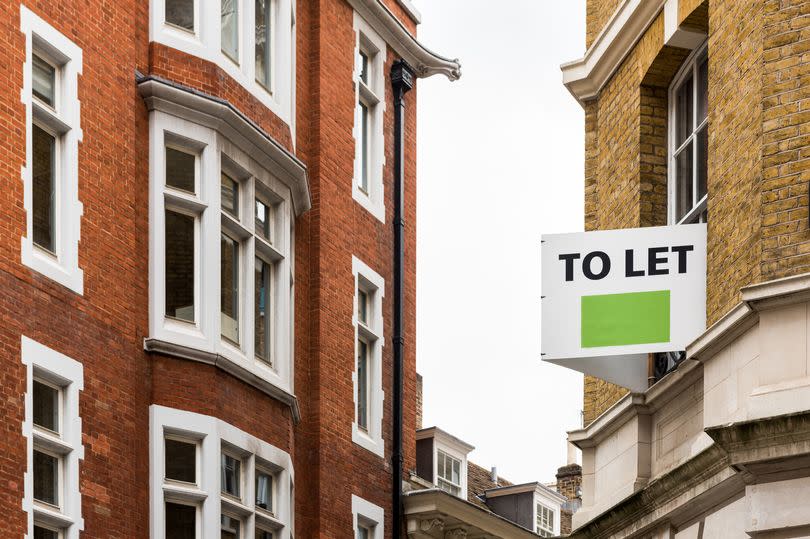
New interactive map shows which areas in Kent spend most of their wages on rent

Renting a home in Kent is becoming increasingly unaffordable, with at least four regions seeing the average person spending more than half of their wage on rent. It costs £1,598 a month on average to rent a home in Sevenoaks in the year to March 2024, according to the latest figures from the Office for National Statistics.
That’s up by more than a third (35.2 per cent) from £1,182 in March 2015. The average full-time worker in the area earned an estimated £32,065 after tax last year.
That’s up 23.1 per cent from £26,053 in 2014. That’s a lower rate of increase than rents.
READ MORE: Lidl announces plans to open new Kent stores - list of 32 potential locations
READ MORE: Busy stretch of M20 to see closures over bank holiday weekend
It means the average rent in the area is now 59.8 per cent of the typical take-home pay, up from 54.4 per cent in 2015. It makes Sevenoaks the most unaffordable place to rent a home in Kent.
Dartford is the next least affordable place in our county. The average home there cost £1,371 a month to rent in the year to March 2024, up by half from £919 in 2015.
That works out as 56.1 per cent of the average take-home pay, up from 44.6 per cent in 2015. In Tunbridge Wells, the average rent makes up 53.7 per cent of the typical take-home pay (up from 41.6 per cent in 2015), and in Maidstone the average rent makes up 50.3 per cent of take-home pay (up from 41.1 per cent in 2015).
You can see how rent affordability has changed over time in our region as well as in other parts of the country by using our interactive map below:
People in Great Britain spend more than half of their take-home pay on rent, as wages fail to keep up with soaring prices.
It cost £1,246 a month on average to rent a home in Britain in the year to March 2024.
That’s up by 9.1 per cent compared to the same time last year, and by 34.8 per cent since March 2015, when the average home cost £924 a month to rent. Meanwhile, the average full-time employee earned an estimated £27,825 last year after tax and national insurance were deducted.
That’s up by 23.1 per cent from 2014, when the average take-home pay was £22,597 for full-time workers. That’s almost 12 percentage points less than rents have increased by in that time.
It means that renting the average British home now costs 53.7 per cent of the typical take-home pay, up from 49.1 per cent back in 2015. The figures come from exclusive analysis of official earnings and rent price data by the Reach Data Unit.
Take-home pay has been calculated by deducting income tax and national insurance from the median salary in each local authority, for each year from 2014 to 2023. Bristol has seen the biggest increase of rent unaffordability in the country.
The cost of renting in the city has increased at more than twice the rate of full-time salaries. It costs £1,748 a month to rent the average home in Bristol in the 12 months to March 2024. That’s 64.6 per cent more than in March 2015.
Take-home pay, meanwhile, has increased by 28.2 per cent to an average of £28,288. It means that renting the average home costs 74.2 per cent of the typical take-home wage, making Bristol one of the least affordable places to rent in the country.
The most unaffordable places to rent are all in London. The average cost of renting a home in Westminster works out as 91.6 per cent of the average take-home pay.
Average rents in Camden account for 85.9 per cent of the average take-home pay. In Hammersmith and Fulham the ratio is 85.3 per cent, in Islington it’s 84.2 per cent, and in Hackney it’s 82.0 per cent.
Deputy chief executive of generation rent Dan Wilson Craw said: “Something has gone very wrong in this country when a home – one of the most basic things we need for a decent life – is becoming more expensive in relation to what we earn. Rent is our biggest cost and if living standards are going to improve it needs to come down. That means building more homes where people want to live, including social housing so that everyone can put a roof over their heads.”
Get more news from KentLive straight to your inbox for free HERE.

 Yahoo News
