
 Yahoo News
 What the latest NHS performance figures for England show
Waiting times for A&E have improved, though ambulance response times have lengthened and the size of the waiting list for treatment has gone up.
Here are the main figures from the latest NHS performance data for England:
– Overall waiting list
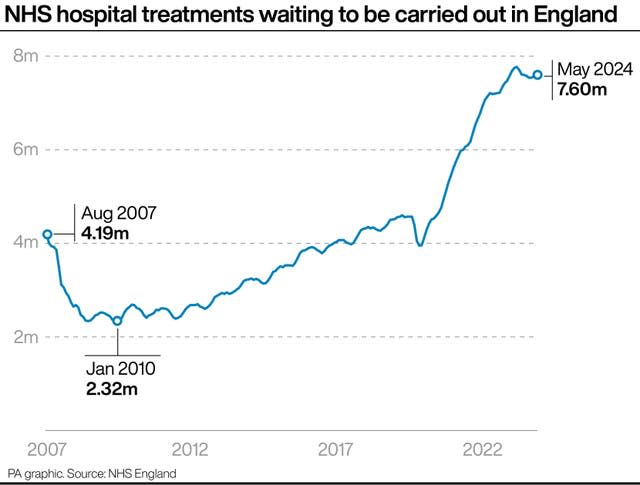
The waiting list for routine hospital treatment has risen for the second month in a row.
An estimated 7.60 million treatments were waiting to be carried out at the end of May, relating to 6.38 million patients – up slightly from 7.57 million treatments and 6.33 million patients at the end of April.
The list hit a record high in September 2023 with 7.77 million treatments and 6.50 million patients, after which the figures began to fall, before showing an increase in both April and May this year.
The size of the list has been growing for much of the last 10 years, passing three million in 2014, four million in 2017, five million in 2021 and seven million in 2022.
In February 2020, the last full month before the start of the Covid-19 pandemic, the list stood at 4.57 million.
Since February 2024, treatments by community services are no longer included in the data, meaning the overall number of incidences of people waiting for treatment in England is likely to be higher than the latest figures.
Community services cover treatments and procedures that are delivered mainly in people’s homes, as well as care homes, clinics, schools, other care facilities and community hospitals.
– Long waits for treatment
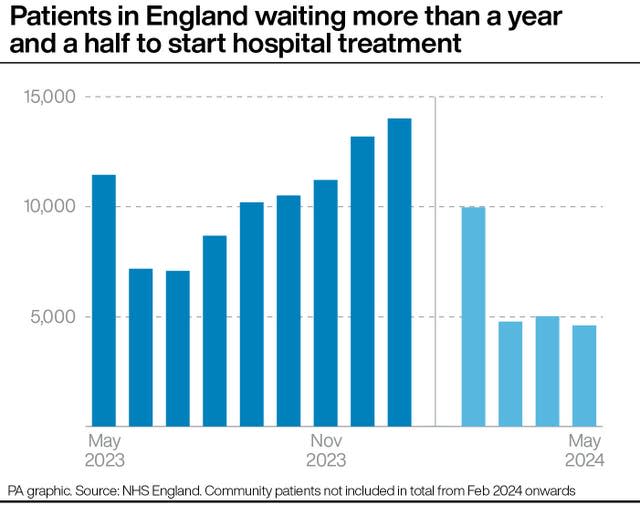
Some 4,597 patients had been waiting more than 18 months to start routine treatment at the end of May, down from 5,013 in April.
The Government and NHS England set the ambition of eliminating all waits of more than 18 months by April 2023, excluding exceptionally complex cases or patients who choose to wait longer.
There were 55,955 patients who had been waiting more than 65 weeks to start treatment at the end of May, up from 50,397 in April.
The target to eliminate all waits of more than 65 weeks is now September 2024, having previously been March 2024.
Meanwhile, 307,500 people had been waiting more than 52 weeks to start routine hospital treatment at the end of May, up from 302,589 at the end of April.
The Government and NHS England have set the ambition of eliminating all waits of more than a year by March 2025.
– Accident & emergency waits
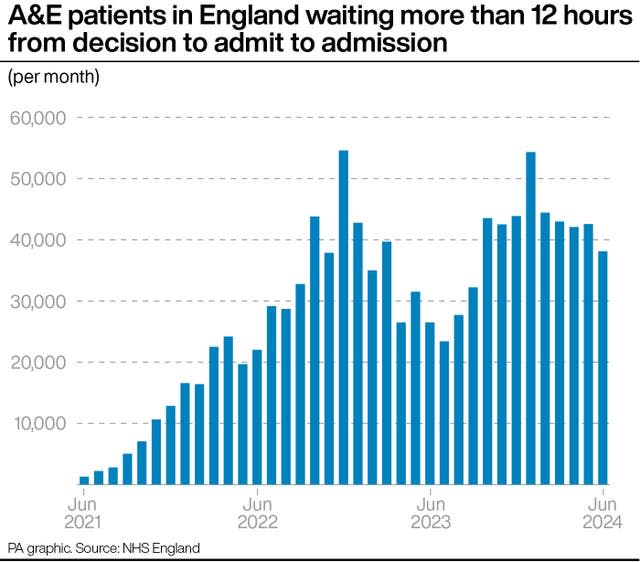
There were 38,106 people who had to wait more than 12 hours in A&E departments in June from a decision to admit to actually being admitted, down from 42,555 in May.
The record high for a calendar month is 54,573, which occurred in December 2022.
The number waiting at least four hours from the decision to admit to admission also fell, from 138,770 in May to 128,114 in June.
Some 74.6% of patients in England were seen within four hours in A&Es last month, up from 74.0% in May.
The NHS recovery plan set a target of March this year for 76% of patients attending A&E to be admitted, transferred or discharged within four hours.
– Cancer referrals
A total of 76.4% of patients urgently referred for suspected cancer in May were diagnosed or had cancer ruled out within 28 days.
This is up from 73.5% the previous month and is above the target of 75%.
It is only the third time the target has been exceeded since it was introduced in autumn 2021.
The proportion of patients waiting no longer than 62 days in May from an urgent suspected cancer referral or consultant upgrade to their first definitive treatment for cancer was 65.8%, down from 66.6% in April.
The target is 85%.
GPs in England made 270,583 urgent cancer referrals in May, up from 260,108 in April and also up year-on-year from 245,849 in May 2023.
– Cancer diagnostic waiting list
The number of patients waiting longer than 62 days since an urgent GP referral for suspected cancer was 17,709 in the week ending June 2 2024, up from 17,356 in the week ending May 5.
The figure was nearly 34,000 at the end of September 2022.
Most of the patients included in this total do not have cancer and are waiting for a diagnostic test, while around one in six do have cancer and are waiting for treatment.
The Government and NHS England set the ambition of returning this figure to pre-pandemic levels by March 2023.
The average weekly figure for the pre-pandemic month of February 2020 (covering the four weeks to March 1) was 13,463.
– Ambulance response times
The average response time in June for ambulances dealing with the most urgent incidents, defined as calls from people with life-threatening illnesses or injuries, was eight minutes and 21 seconds.
This is up slightly from eight minutes and 16 seconds in May and is above the target standard response time of seven minutes.
Ambulances took an average of 34 minutes and 38 seconds last month to respond to emergency calls such as heart attacks, strokes and sepsis.
This is up from 32 minutes and 44 seconds in May, while the target is 18 minutes.
Response times for urgent calls, such as late stages of labour, non-severe burns and diabetes, averaged two hours, two minutes and 34 seconds in June, up from exactly two hours in May.

