One in 14 young people in England and Wales identify as LGB+, census shows
Nearly one in 14 young people in England and Wales identify as lesbian, gay, bisexual or another minority sexual orientation (LGB+), more than twice the level for the overall population, the 2021 census shows.
There are sharp variations across the country, with some local areas recording as many as one in six 16 to 24-year-olds identifying as LGB+.
Young adults are also the most likely age group to say their gender identity is different from their sex registered at birth, with one in 100 identifying as such.
The census took place in England and Wales on March 21 2021 and its findings are being released in stages by the Office for National Statistics (ONS).

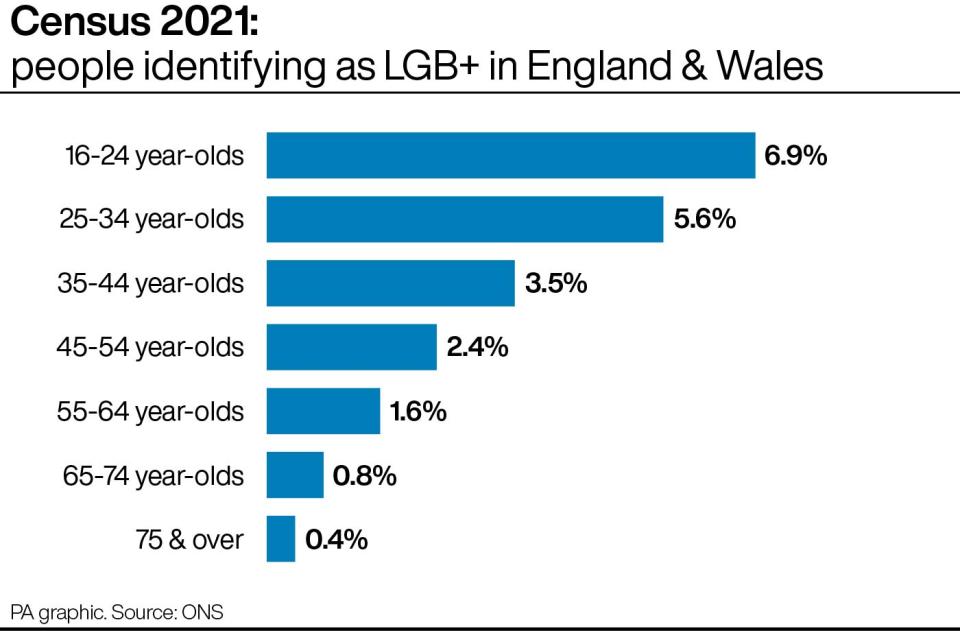
The latest data shows that 6.9% of 16 to 24-year-olds identify as LGB+, the highest proportion of any age group and more than twice the figure for the total population (3.2%).
The proportion identifying as LGB+ drops for each successive age group, with 5.6% of 25 to 34-year-olds and 3.5% of 35 to 44-year-olds, then 2.4% of people aged 45-54, 1.6% of those aged 55-64, 0.8% of 65-74s and 0.4% of those 75 and over.
But while in most age groups a greater percentage of people identify as gay or lesbian than bisexual, the opposite is true for 16 to 24-year-olds, with 4.0% identifying as bisexual compared with 2.1% as gay or lesbian.
The census suggests there is a slightly higher proportion of LGB+ males in England (3.0%) than Wales (2.7%), while for females the figure is similar (3.3%).
The category LGB+ covers people identifying as lesbian, gay or bisexual, as well as pansexual, asexual, queer or any other sexual orientation.
“Local authorities with a relatively high proportion of people aged 16 to 24 who identified as LGB+ tended to have one or more universities,” the ONS said.
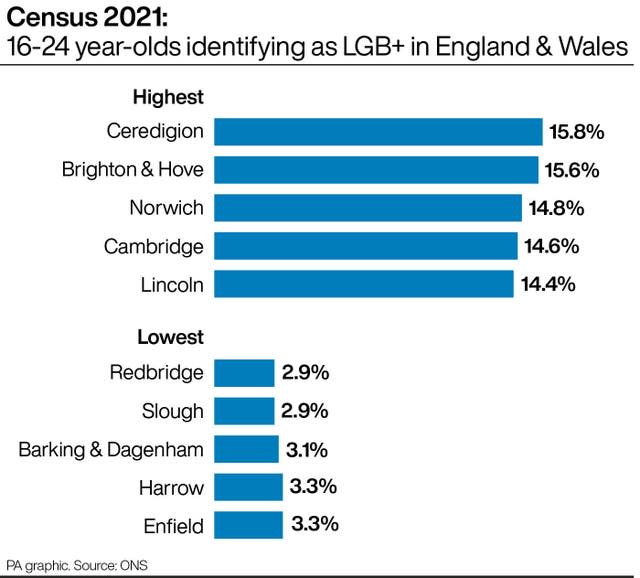
Top of the list is Ceredigion in west Wales, where 15.8% of 16 to 24-year-olds identify as LGB+.
This is followed by Brighton & Hove (15.6%), Norwich (14.8%), Cambridge (14.6%), Lincoln (14.4%) and York (14.3%).

The lowest percentages are for Redbridge in London and Slough in Berkshire (both 2.9%), followed by the London boroughs of Barking & Dagenham (3.1%), Harrow (3.3%) and Enfield (3.3%).
London boroughs have some of the highest LGB+ proportions for older age groups, however.
Around one in 10 (9.8%) of 35 to 44-year-olds in Lambeth identify at LGB+, with 9.0% in Southwark, 8.2% in Hackney and 8.0% in Islington.
Only Brighton & Hove (11.1%) has a higher percentage for this age group.
Lambeth is also the only local authority where people aged 35 to 44 are most likely to identify as LGB+.
London accounts for eight of the 10 highest local LGB+ percentages for 45 to 54-year-olds and 55 to 64-year-olds, and nine of the 10 among those aged 65 to 74.
The only age group where a London borough is top of the list is for people aged 75 and over, with Westminster & City of London having the highest LGB+ percentage (2.4%), followed by Brighton & Hove (2.3%), Hammersmith & Fulham (2.2%), Kensington & Chelsea (2.2%) and Camden (2.1%).
The proportion of people in England and Wales saying their gender identify is different from their sex registered at birth decreases as age groups get older, mirroring the trend for sexual orientation.

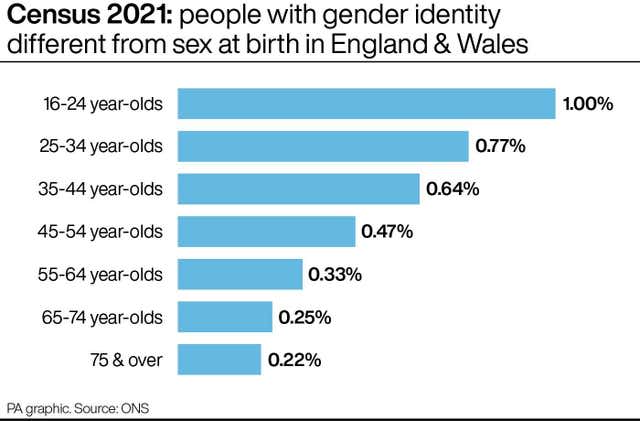
Some 1.00% of 16 to 24-year-olds identify this way, dropping to 0.77% of 25 to 34-year-olds and 0.64% of 35 to 44-year-olds, then 0.47% of people aged 45-54, 0.33% of those aged 55-64, 0.25% of 65 to 74-year-olds, and 0.22% of those aged 75 and over.
The figures are shown to two decimal places because the numbers are so small.
The ONS refers to people in this category as being trans.
A higher proportion of people in England (0.55%) identify as trans than in Wales (0.40%), with the largest percentage-point difference among people aged 35 to 44 (0.65% compared with 0.37%).
Ceredigion is the local authority with the highest proportion of 16 to 24-year-olds identifying as trans (2.48%), followed by Norwich (1.96%), Brighton & Hove (1.96%), Lincoln (1.77%) and Haringey (1.65%).
For people aged 75 and over, the highest percentage is in Newham (0.82%), followed by Hackney (0.75%), Southwark (0.66%), Rushmoor (0.66%) and Islington (0.65%).

 Yahoo News
