
 Yahoo News
 A Sliding Share Price Has Us Looking At Seven Group Holdings Limited's (ASX:SVW) P/E Ratio

To the annoyance of some shareholders, Seven Group Holdings (ASX:SVW) shares are down a considerable 36% in the last month. Indeed the recent decline has arguably caused some bitterness for shareholders who have held through the 39% drop over twelve months.
All else being equal, a share price drop should make a stock more attractive to potential investors. In the long term, share prices tend to follow earnings per share, but in the short term prices bounce around in response to short term factors (which are not always obvious). So, on certain occasions, long term focussed investors try to take advantage of pessimistic expectations to buy shares at a better price. One way to gauge market expectations of a stock is to look at its Price to Earnings Ratio (PE Ratio). A high P/E implies that investors have high expectations of what a company can achieve compared to a company with a low P/E ratio.
Check out our latest analysis for Seven Group Holdings
How Does Seven Group Holdings's P/E Ratio Compare To Its Peers?
Seven Group Holdings's P/E of 18.75 indicates some degree of optimism towards the stock. You can see in the image below that the average P/E (14.7) for companies in the trade distributors industry is lower than Seven Group Holdings's P/E.
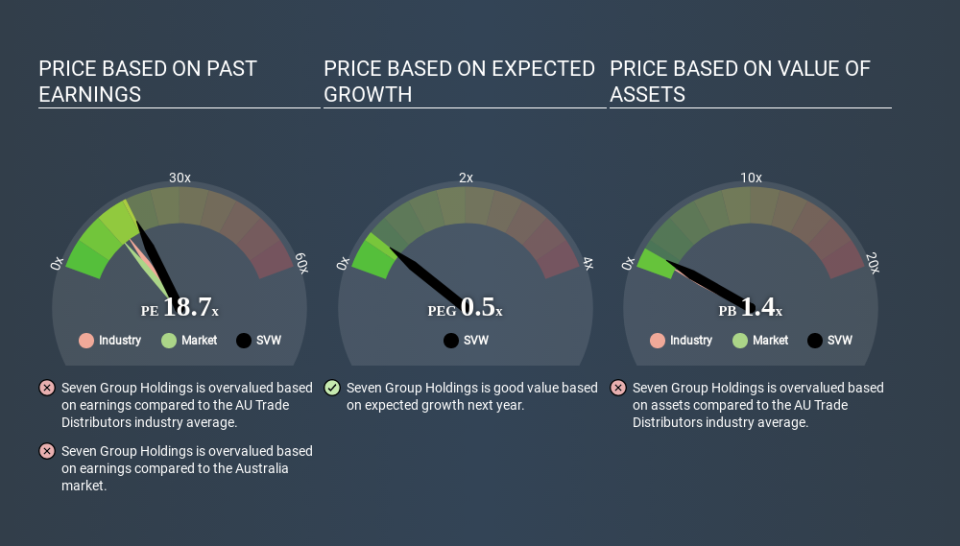
That means that the market expects Seven Group Holdings will outperform other companies in its industry. The market is optimistic about the future, but that doesn't guarantee future growth. So further research is always essential. I often monitor director buying and selling.
How Growth Rates Impact P/E Ratios
Earnings growth rates have a big influence on P/E ratios. When earnings grow, the 'E' increases, over time. That means even if the current P/E is high, it will reduce over time if the share price stays flat. Then, a lower P/E should attract more buyers, pushing the share price up.
Seven Group Holdings saw earnings per share decrease by 33% last year. But it has grown its earnings per share by 35% per year over the last five years.
Don't Forget: The P/E Does Not Account For Debt or Bank Deposits
The 'Price' in P/E reflects the market capitalization of the company. In other words, it does not consider any debt or cash that the company may have on the balance sheet. In theory, a company can lower its future P/E ratio by using cash or debt to invest in growth.
Such expenditure might be good or bad, in the long term, but the point here is that the balance sheet is not reflected by this ratio.
Is Debt Impacting Seven Group Holdings's P/E?
Net debt totals 53% of Seven Group Holdings's market cap. This is enough debt that you'd have to make some adjustments before using the P/E ratio to compare it to a company with net cash.
The Bottom Line On Seven Group Holdings's P/E Ratio
Seven Group Holdings has a P/E of 18.7. That's higher than the average in its market, which is 12.9. With relatively high debt, and no earnings per share growth over twelve months, it's safe to say the market believes the company will improve its earnings growth in the future. Given Seven Group Holdings's P/E ratio has declined from 29.3 to 18.7 in the last month, we know for sure that the market is significantly less confident about the business today, than it was back then. For those who prefer to invest with the flow of momentum, that might be a bad sign, but for a contrarian, it may signal opportunity.
Investors should be looking to buy stocks that the market is wrong about. If the reality for a company is better than it expects, you can make money by buying and holding for the long term. So this free report on the analyst consensus forecasts could help you make a master move on this stock.
But note: Seven Group Holdings may not be the best stock to buy. So take a peek at this free list of interesting companies with strong recent earnings growth (and a P/E ratio below 20).
If you spot an error that warrants correction, please contact the editor at editorial-team@simplywallst.com. This article by Simply Wall St is general in nature. It does not constitute a recommendation to buy or sell any stock, and does not take account of your objectives, or your financial situation. Simply Wall St has no position in the stocks mentioned.
We aim to bring you long-term focused research analysis driven by fundamental data. Note that our analysis may not factor in the latest price-sensitive company announcements or qualitative material. Thank you for reading.

