
 Yahoo News
 Why Your Favorite TV Shows Are Getting Shorter | Charts
The television industry has been changing over the last few years. One of these shifts is the way TV shows are structured and delivered. Not long ago, the norm was for TV series with longer seasons, typically ranging from 20 to 24 episodes, to fit the schedules of network television. More recently, the trend has shifted towards more succinct seasons, often with fewer episodes. This reflects changes in audience expectations, viewership patterns, network strategies and the advent of streaming platforms.
The model introduced by the proliferation of streaming platforms favors more condensed episodes when compared to the traditional network model. However, the gap between the average season lengths of network and streaming shows has narrowed over the last six years. The average number of shows per season for network shows decreased from 15.4 in 2018 to 10.2 in 2023, closely mirroring the average for streaming shows at 9.6 episodes in the same year.
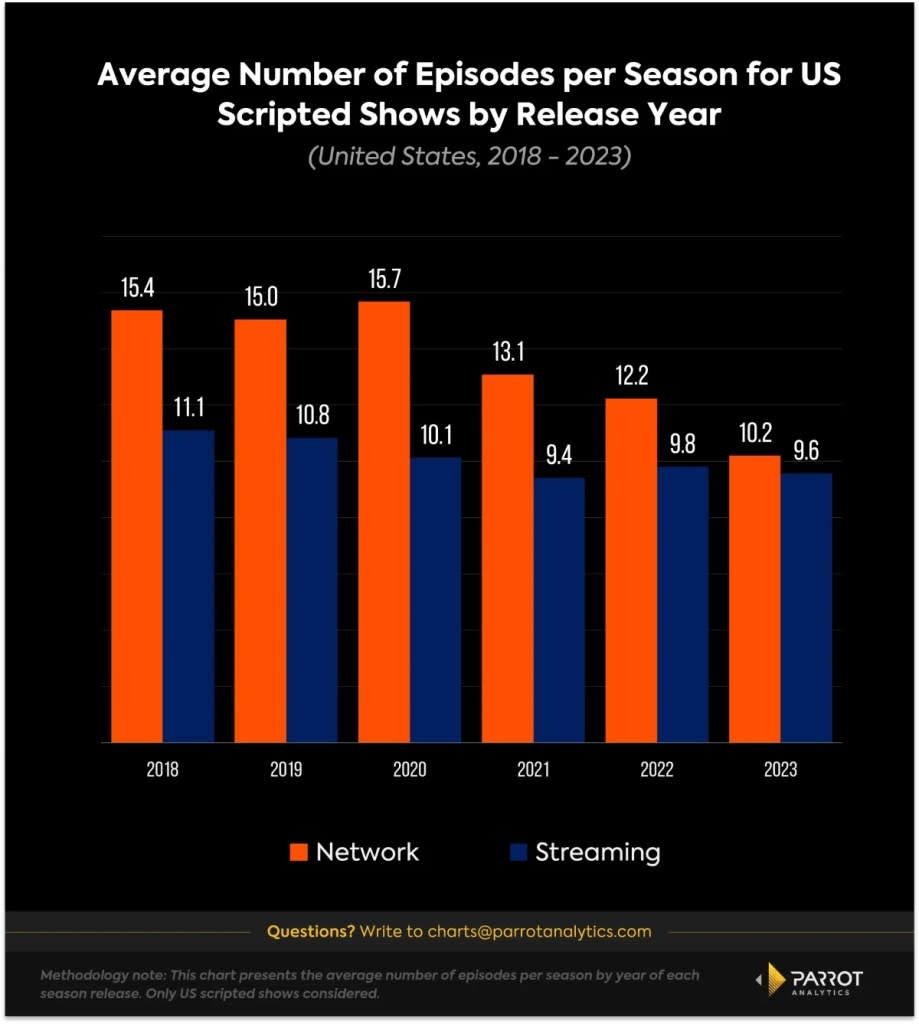
This shift reflects not only the growth of streaming TV, but also a broader change in viewer preferences. Audiences today seem to prefer tightly knit narratives, leading to a decline in the popularity of long-running seasons. Data shows a stark decline in the proportion of U.S. scripted shows releasing new seasons with more than 20 episodes, dropping from 19% in 2018 to just 4.5% in 2023.
These trends raise questions about how audiences engage with episodically released content. Are audiences maintaining interest throughout the season or do they lose engagement midway? Using Parrot Analytics demand data, it’s possible to analyze when the peak demand for a season occurs. If it occurs near or at the last episode, it indicates that audiences are maintaining interest until the end of the season.
Around 40% of network-released shows saw their peak demand during the season finale over the last six years. HBO stands out, with over 50% of its seasons peaking in demand around the finale, a testament to its ability to captivate audiences consistently. Among the other major broadcast networks, this share ranges between 40% and 45%.
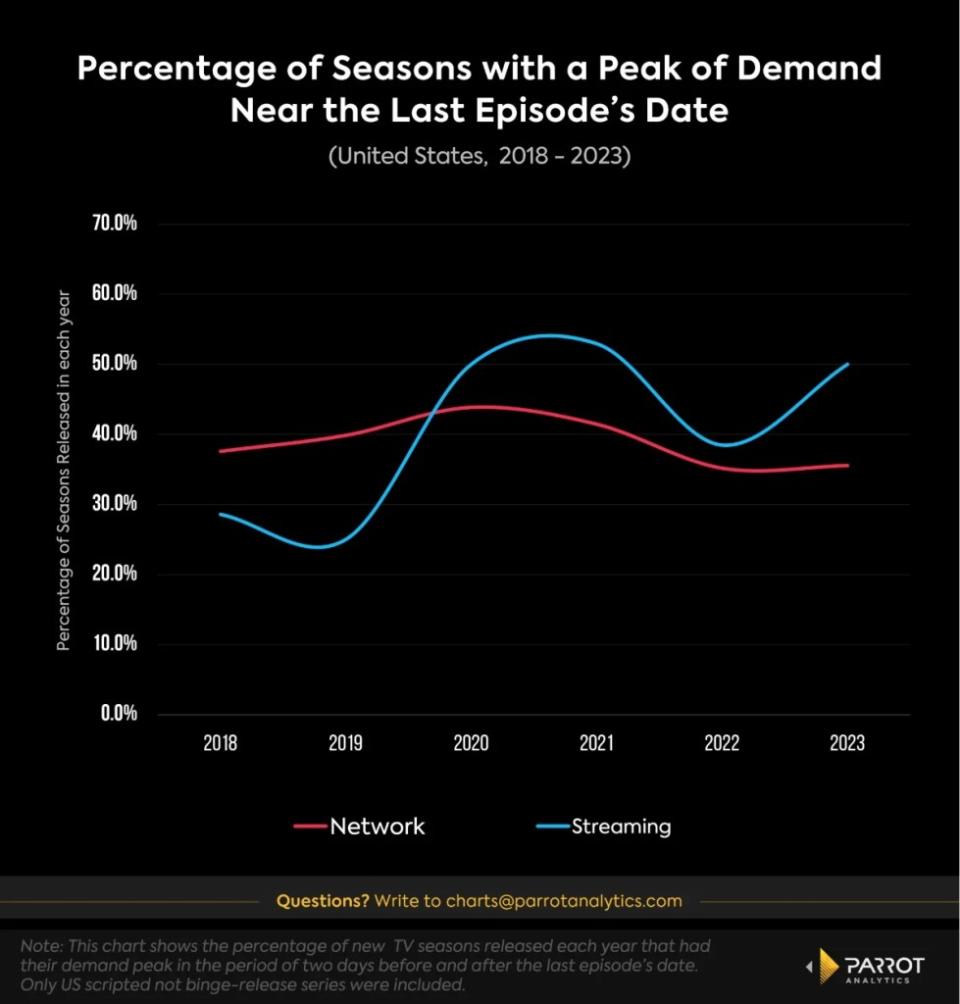
For streaming services (excluding binge-released shows), there’s been an uptick in seasons that maintain viewer interest until the conclusion, growing from 30% in 2018 to nearly 50% in 2023. “Only Murders In The Building” Season 2, both seasons of “Our Flag Means Death” and “The Orville” Season 3 exemplify this trend, maintaining high audience engagement through their finales, all released after 2022.
Streaming platforms are adapting their shows’ storylines and screenplays to create content that holds people’s attention until its conclusion. This includes using cliffhangers and other writing techniques to keep viewers looking forward to the next episode. On the same page, seasons are getting shorter for both network and streaming shows, reflecting a landscape where the competition for the audience’s attention gets fiercer.
Daniel Quinaud is a senior data analyst at Parrot Analytics, a WrapPRO partner. For more from Parrot Analytics, visit the Data and Analysis Hub.
The post Why Your Favorite TV Shows Are Getting Shorter | Charts appeared first on TheWrap.

