
 Yahoo News
 Why We’re Not Keen On Issuer Direct Corporation’s (NYSEMKT:ISDR) 2.4% Return On Capital

Today we'll evaluate Issuer Direct Corporation (NYSEMKT:ISDR) to determine whether it could have potential as an investment idea. Specifically, we'll consider its Return On Capital Employed (ROCE), since that will give us an insight into how efficiently the business can generate profits from the capital it requires.
First of all, we'll work out how to calculate ROCE. Next, we'll compare it to others in its industry. Last but not least, we'll look at what impact its current liabilities have on its ROCE.
Understanding Return On Capital Employed (ROCE)
ROCE is a measure of a company's yearly pre-tax profit (its return), relative to the capital employed in the business. Generally speaking a higher ROCE is better. Overall, it is a valuable metric that has its flaws. Renowned investment researcher Michael Mauboussin has suggested that a high ROCE can indicate that 'one dollar invested in the company generates value of more than one dollar'.
So, How Do We Calculate ROCE?
The formula for calculating the return on capital employed is:
Return on Capital Employed = Earnings Before Interest and Tax (EBIT) ÷ (Total Assets - Current Liabilities)
Or for Issuer Direct:
0.024 = US$655k ÷ (US$30m - US$3.0m) (Based on the trailing twelve months to September 2019.)
So, Issuer Direct has an ROCE of 2.4%.
See our latest analysis for Issuer Direct
Is Issuer Direct's ROCE Good?
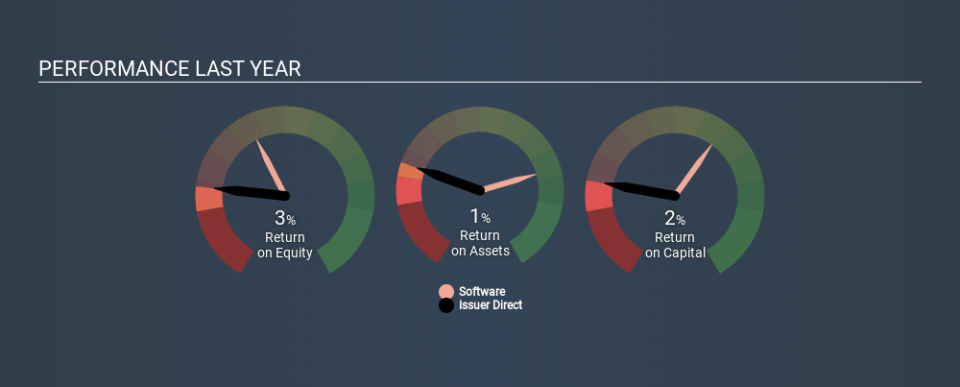
When making comparisons between similar businesses, investors may find ROCE useful. In this analysis, Issuer Direct's ROCE appears meaningfully below the 9.8% average reported by the Software industry. This performance could be negative if sustained, as it suggests the business may underperform its industry. Independently of how Issuer Direct compares to its industry, its ROCE in absolute terms is low; especially compared to the ~1.7% available in government bonds. Readers may wish to look for more rewarding investments.
Issuer Direct's current ROCE of 2.4% is lower than its ROCE in the past, which was 16%, 3 years ago. This makes us wonder if the business is facing new challenges. The image below shows how Issuer Direct's ROCE compares to its industry, and you can click it to see more detail on its past growth.
When considering ROCE, bear in mind that it reflects the past and does not necessarily predict the future. Companies in cyclical industries can be difficult to understand using ROCE, as returns typically look high during boom times, and low during busts. ROCE is only a point-in-time measure. Since the future is so important for investors, you should check out our free report on analyst forecasts for Issuer Direct.
Issuer Direct's Current Liabilities And Their Impact On Its ROCE
Liabilities, such as supplier bills and bank overdrafts, are referred to as current liabilities if they need to be paid within 12 months. Due to the way ROCE is calculated, a high level of current liabilities makes a company look as though it has less capital employed, and thus can (sometimes unfairly) boost the ROCE. To check the impact of this, we calculate if a company has high current liabilities relative to its total assets.
Issuer Direct has total assets of US$30m and current liabilities of US$3.0m. Therefore its current liabilities are equivalent to approximately 9.8% of its total assets. Issuer Direct has a low level of current liabilities, which have a negligible impact on its already low ROCE.
What We Can Learn From Issuer Direct's ROCE
Nevertheless, there are potentially more attractive companies to invest in. You might be able to find a better investment than Issuer Direct. If you want a selection of possible winners, check out this free list of interesting companies that trade on a P/E below 20 (but have proven they can grow earnings).
If you are like me, then you will not want to miss this free list of growing companies that insiders are buying.
If you spot an error that warrants correction, please contact the editor at editorial-team@simplywallst.com. This article by Simply Wall St is general in nature. It does not constitute a recommendation to buy or sell any stock, and does not take account of your objectives, or your financial situation. Simply Wall St has no position in the stocks mentioned.
We aim to bring you long-term focused research analysis driven by fundamental data. Note that our analysis may not factor in the latest price-sensitive company announcements or qualitative material. Thank you for reading.

