
 Yahoo News
 Should We Worry About Xinyi Glass Holdings Limited's (HKG:868) P/E Ratio?

Today, we'll introduce the concept of the P/E ratio for those who are learning about investing. We'll show how you can use Xinyi Glass Holdings Limited's (HKG:868) P/E ratio to inform your assessment of the investment opportunity. Looking at earnings over the last twelve months, Xinyi Glass Holdings has a P/E ratio of 10.21. That is equivalent to an earnings yield of about 9.8%.
View our latest analysis for Xinyi Glass Holdings
How Do You Calculate Xinyi Glass Holdings's P/E Ratio?
The formula for P/E is:
Price to Earnings Ratio = Price per Share ÷ Earnings per Share (EPS)
Or for Xinyi Glass Holdings:
P/E of 10.21 = HKD11.12 ÷ HKD1.09 (Based on the year to June 2019.)
Is A High Price-to-Earnings Ratio Good?
The higher the P/E ratio, the higher the price tag of a business, relative to its trailing earnings. That isn't necessarily good or bad, but a high P/E implies relatively high expectations of what a company can achieve in the future.
How Does Xinyi Glass Holdings's P/E Ratio Compare To Its Peers?
We can get an indication of market expectations by looking at the P/E ratio. The image below shows that Xinyi Glass Holdings has a P/E ratio that is roughly in line with the auto components industry average (10.2).
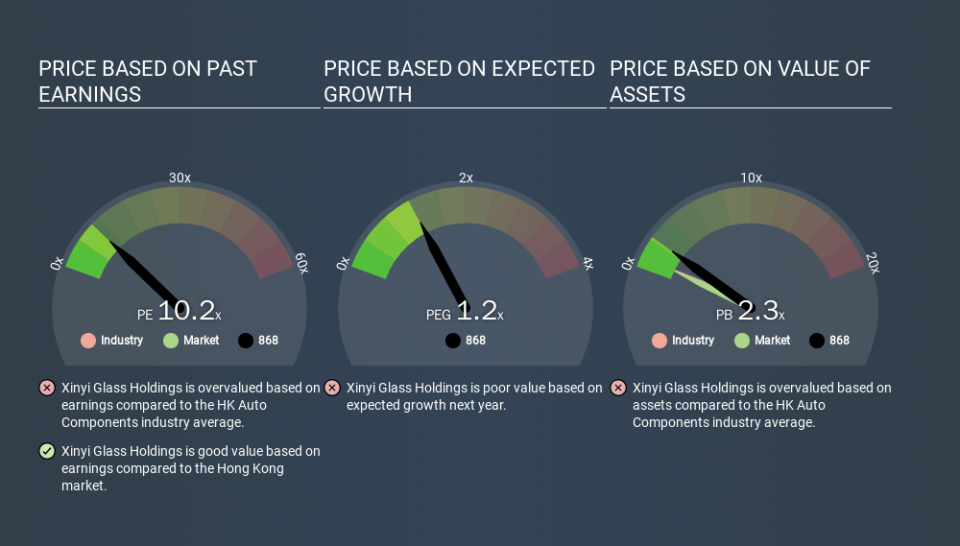
That indicates that the market expects Xinyi Glass Holdings will perform roughly in line with other companies in its industry. So if Xinyi Glass Holdings actually outperforms its peers going forward, that should be a positive for the share price. Checking factors such as director buying and selling. could help you form your own view on if that will happen.
How Growth Rates Impact P/E Ratios
P/E ratios primarily reflect market expectations around earnings growth rates. That's because companies that grow earnings per share quickly will rapidly increase the 'E' in the equation. That means even if the current P/E is high, it will reduce over time if the share price stays flat. And as that P/E ratio drops, the company will look cheap, unless its share price increases.
Xinyi Glass Holdings had pretty flat EPS growth in the last year. But it has grown its earnings per share by 6.5% per year over the last five years.
Remember: P/E Ratios Don't Consider The Balance Sheet
Don't forget that the P/E ratio considers market capitalization. So it won't reflect the advantage of cash, or disadvantage of debt. The exact same company would hypothetically deserve a higher P/E ratio if it had a strong balance sheet, than if it had a weak one with lots of debt, because a cashed up company can spend on growth.
Such spending might be good or bad, overall, but the key point here is that you need to look at debt to understand the P/E ratio in context.
Is Debt Impacting Xinyi Glass Holdings's P/E?
Xinyi Glass Holdings's net debt is 10% of its market cap. It would probably deserve a higher P/E ratio if it was net cash, since it would have more options for growth.
The Verdict On Xinyi Glass Holdings's P/E Ratio
Xinyi Glass Holdings's P/E is 10.2 which is about average (10.5) in the HK market. When you consider the lack of EPS growth last year (along with some debt), it seems the market is optimistic about the future for the business.
Investors have an opportunity when market expectations about a stock are wrong. As value investor Benjamin Graham famously said, 'In the short run, the market is a voting machine but in the long run, it is a weighing machine. So this free visual report on analyst forecasts could hold the key to an excellent investment decision.
Of course you might be able to find a better stock than Xinyi Glass Holdings. So you may wish to see this free collection of other companies that have grown earnings strongly.
If you spot an error that warrants correction, please contact the editor at editorial-team@simplywallst.com. This article by Simply Wall St is general in nature. It does not constitute a recommendation to buy or sell any stock, and does not take account of your objectives, or your financial situation. Simply Wall St has no position in the stocks mentioned.
We aim to bring you long-term focused research analysis driven by fundamental data. Note that our analysis may not factor in the latest price-sensitive company announcements or qualitative material. Thank you for reading.

