
 Yahoo News
 How the 2017 general election determined the fate of Brexit

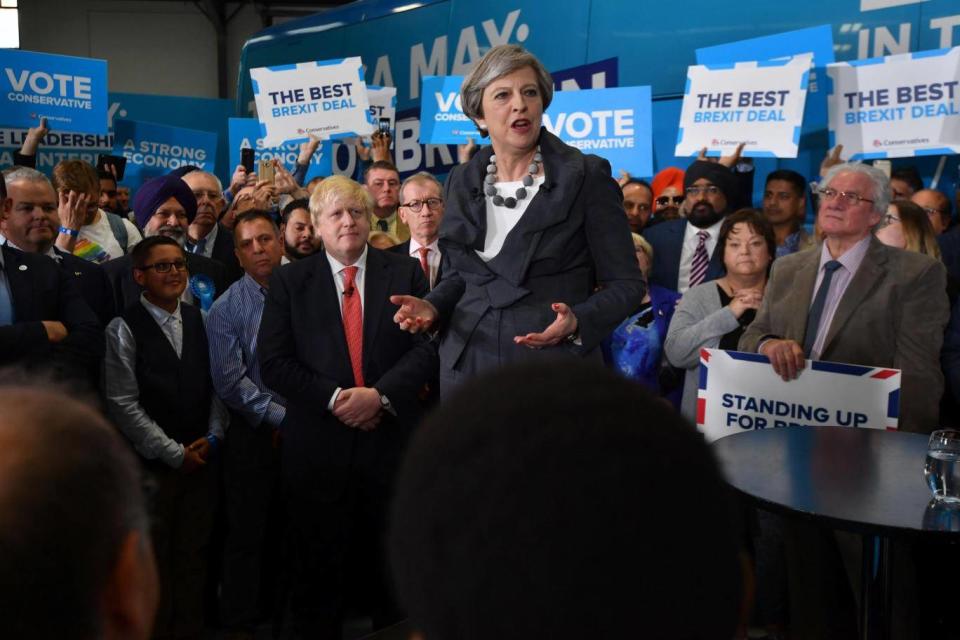
If voters agreed with the prime minister that the 2017 general election was about Brexit, then – given that her vision of Britain’s future relationship with the EU was widely regarded as representing a “hard” Brexit (prioritising control of immigration over continued membership of the EU single market) – we might expect her party to have advanced more strongly in places where the previous year a relatively high proportion had voted to leave the EU.
Our analysis suggests this is precisely what happened. The higher the estimated vote for Leave in 2016, the more the Conservative vote increased, while support for the party actually fell back on average in places where Leave failed to secure at least 45 per cent of the vote.
The link between Labour’s performance and the strength of the Leave vote in 2016 is much weaker, a finding that might be thought to reflect the party’s relatively ambiguous position on Brexit.
There was only a three-point difference between the increase in the Labour vote in places where 60 per cent or more voted to Leave and the equivalent figure for constituencies where less than 45 per cent voted to Leave – far less than the corresponding difference of 12 points in the Conservative performance.
Even so, between them these two patterns are sufficiently strong that in seats where more than 60 per cent voted to Leave, there was on average a net (total vote) swing of 0.8 per cent from Labour to the Conservatives, even though everywhere else in England and Wales Labour’s vote increased more than that of the Conservatives.
Where did the Ukip vote go?
A key reason why the link between the Conservative performance and the strength of the Leave vote is much stronger than that for Labour lies in the impact on the two parties’ performances of the collapse in the Ukip vote.
Ukip’s share of the vote in the 2015 election was much larger in areas where Leave did well in the referendum. The decline in Ukip support two years later was almost invariably greatest where the party had previously been strongest. If those who voted Ukip in 2015 (nearly all of whom voted to Leave in 2016) were now particularly inclined to switch to the Conservatives, this could have served to boost the Conservative performance in constituencies that voted heavily to Leave.
Indeed, while Labour appears to have won some of the voters that Ukip lost, the Conservatives apparently gained many more.

Nevertheless, the collapse in Ukip support is far from being the whole explanation for the strong Conservative performance in areas keenest on leaving the EU. Even when we take into account how heavily Ukip support fell, the Conservatives still performed better where the Leave vote was stronger in 2016.
Where did Remain and Leave voters go?
The Conservative Party did not do well in places where Leave was strong in 2016 only because of the pattern of switching among former Ukip voters; rather, Leave voters more generally seem to have been drawn into voting Conservative at this election, while Remain voters tilted towards Labour.
Support for Ukip in 2015 and for Leave in 2016 varied substantially by age and educational background. Both were particularly popular with older people and those with few or no formal educational qualifications, while younger people and graduates tended to shun Ukip and vote Remain. This pattern was reflected in the Conservative and Labour votes in 2017.
What do Conservative and Labour voters look like?
Conservatives tended to do better where there were more people without any educational qualifications. There is a corresponding, though much weaker tendency in the opposite direction for Labour. At the same time, the Conservatives performed less well and Labour better in seats with more young adults – though once we take this into account, there is no indication, despite the prominence given to Labour’s manifesto promise to scrap tuition fees for students at English universities, that constituencies with large numbers of students were particularly likely to swing towards the party.
The social geography of Conservative and Labour performance at this election was primarily, albeit not entirely, a consequence of the role played by attitudes towards Brexit in shaping how people voted.
What about the economy?
Traditionally, the state of the economy has played a central role in how people vote. In 2015, for example, the Conservatives clearly performed worse where unemployment was highest or had increased most, and where household incomes were relatively low. At this election, however, if anything the opposite was the case.
The worse local economic circumstances were, the better the Conservatives did and the worse Labour did. For instance, Conservative support increased on average by 5.8 points where the constituency unemployment rate increased between 2015 and 2017, compared with 4.9 points where it fell. The equivalent figures for Labour were 9.8 points and 10.4 points respectively. Moreover, despite a continued squeeze on public spending and a promise from the Conservatives of more austerity to come that could mean cuts in public sector jobs, there was, in contrast to 2015, no particular relationship between Conservative or Labour performance and the local prevalence of public sector employees.
Did the antisemitism row hurt Labour?
Not that the focus on Brexit meant that nothing else mattered. Jeremy Corbyn’s views on the Middle East have attracted particular controversy, with critics accusing the Labour leader of being too sympathetic to individuals and groups opposed to Israel, including some widely regarded as extremist. There were related accusations that, under Corbyn’s leadership, the Labour Party had dealt inadequately with allegations that some party members have made antisemitic statements. These issues appear to have made a difference. On average Labour’s vote increased by 11.6 points in constituencies where more than 4 per cent are Muslim, compared with an average increase of 9.6 points elsewhere in England and Wales. This difference is not accounted for by the tendency of the Leave vote to be lower in seats with more Muslims. Meanwhile, and by contrast, the Labour vote only rose by 8.8 points on average across the 10 constituencies with the largest Jewish populations, even though seven of these 10 seats are in London, where Labour generally performed relatively well.

Did social class drive the voting?
However, the fallout from the EU referendum was most important in shaping the geography of Conservative and Labour performance. In so doing, the contest served to reduce some of the traditional divisions in British elections. For example, although working-class voters had traditionally been the bedrock of Labour support, they had also been more likely to vote Leave and to vote for Ukip. Thus, thanks to its gains among such voters, at this election Conservative support increased by as much as 9.4 points in seats where more than 13 per cent are engaged in a routine manual occupation, compared with just 1.3 points where fewer than 10 per cent have a routine job. Conversely, Labour’s support increased by just 9.1 points in relatively working-class seats, but by 10.7 points where relatively few have a routine job.
What happened to the north/south divide?
Equally, the north/south divide in Britain’s electoral geography also narrowed somewhat, the first time it has done so since 1997. A relatively weak Conservative performance and a relatively strong Labour performance across the largely more pro-Remain south of England meant that on average there was as much as a 3.9 point swing from Conservative to Labour there.
In contrast, the swing to Labour was only 1.3 in the north of England and 0.7 in the heavily pro-Leave Midlands. One striking consequence of this divergence is that Conservative support is now higher in the Midlands than in the south of England, not least, but also not solely, because pro-Remain and ethnically diverse London has now become something of a Labour citadel.

Despite initial appearances, therefore, this clearly was not an election that heralded a return to the familiar patterns of two-party politics.
Do constituency boundaries hold the key?
But what about the notion that the makeup of parliament is as much to do with the way constituency boundaries have been drawn as anything else? That question is particularly topical, given current proposals for boundary reform.
The present constituency boundaries are biased against the Conservatives, but this is compensated for by the more efficient distribution of their vote.
Surprising though the failure of the Conservatives to win an overall majority last year might have seemed, was the tally of seats won by each party significantly different from what we might have anticipated given the shares of the vote each of them secured?
The traditional way of addressing this question has been to compare the actual outcome in seats with what would have happened if in every constituency each party’s share of the vote had increased or fallen in line with the change in its overall share of the vote across Britain as a whole – that is, uniform change.
However, applying this method becomes difficult when, as happened in 2015 and again in 2017, there is a substantial change in the level of support for a party, such as the SNP, that only fights elections in one part of the country but wins plenty of seats there. In these circumstances the change in that party’s share of the Britain-wide vote will inevitably be but a pale reflection of the actual rise or fall in its support in the part of the UK where it stood.
It is therefore better to use as our initial benchmark what would have happened if support for all of the main Britain-wide parties had increased or fallen in every constituency in England and Wales in line with the overall change in their support in those two parts of the UK combined. For each seat in Scotland, meanwhile, we calculate what would have happened if the rise or fall in each party’s support had been in line with the change in its share of the Scotland-wide total.
On the basis of these assumptions, the Conservatives would have won 323 seats (instead of 318), Labour 259 (262), the SNP 37 (35), the Liberal Democrat nine (12), Plaid Cymru three (four) and the Greens one (one), while, of course, there would be 18 other MPs from Northern Ireland. None of these figures are very different from what actually transpired and, above all, the Conservatives would still have failed to secure an overall majority – albeit they would have been only three rather than eight seats short.
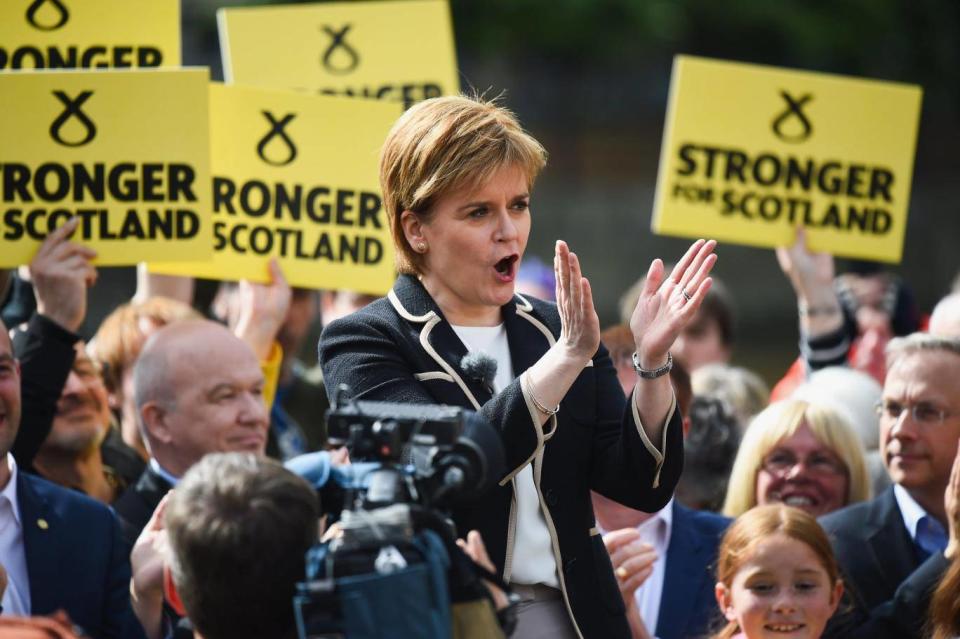
What about Scotland?
That projected Conservative tally includes 11 seats in Scotland. However, if the increase in the Conservative vote north of the border had been in line with the lower increase in England and Wales – and the fall in SNP support had not happened – the Conservatives would have won only two Scottish seats. Thus, in the absence of the distinctive outcome in Scotland, the Conservatives would have won only 314 seats. To that extent, the distinctive result in Scotland proved to be crucial to the arithmetic of the new House of Commons.
What were the other factors?
However, although the overall tally of seats for each party was more or less in line with what might have been expected given the changes in their overall shares of the vote, there were lots of seats where the outcome was at variance with what would have happened if the movements in party support had been the same everywhere.
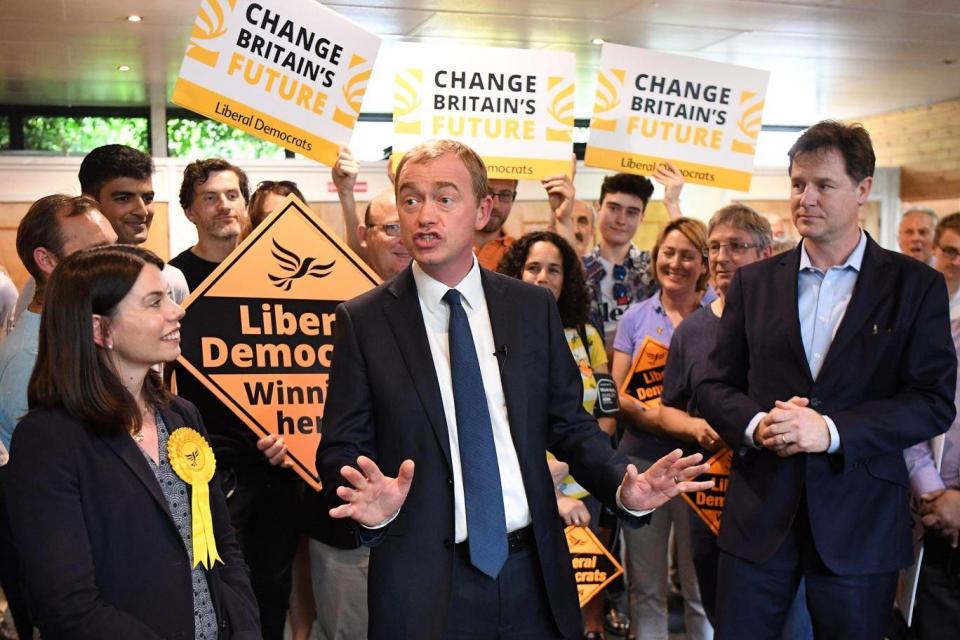
No fewer than 36 seats changed hands that would not have done so under those circumstances, while 16 constituencies were held against the tide. Most of these outcomes can in fact be accounted for by one or other of the systematic patterns of variation our analysis has identified, including the tendency for the Conservatives to perform better in seats with a relatively large Leave vote and Labour to do likewise in seats where Remain polled relatively well, the Conservatives’ ability on occasion to squeeze the other unionist parties in Scotland, and the willingness of some of those who might otherwise have voted Labour to make a tactical switch to the (pro-Remain) Liberal Democrats. In short, much of the significant variation in party performance was linked in some way or other to the fallout from either the 2016 EU referendum or the 2014 Scottish independence referendum.
Can Britain’s voting system deliver stable governments?
This still leaves us with the observation that for the third time in a row, the electoral system failed to deliver the winning party a substantial overall majority (and, indeed, on two occasions any majority at all).
The system’s ability to generate safe overall majorities has long been regarded as a hallmark of the single member plurality system (often referred to as “first past the post”) and the resulting clarity of the link between the outcome of an election and who forms the government is often cited as a major justification for its continued use.
It might be thought the explanation is that, at 2.5 points, the Conservative lead over Labour in terms of votes across Great Britain as a whole was a relatively narrow one. It was certainly much narrower than the seven point leads that the Conservatives enjoyed in 2010 and 2015. Yet it was larger than the leads (in Great Britain) that the Conservatives enjoyed in 1955 (1.9 points) and 1970 (2.3 points) or Labour did in 1964 (1.9 points), yet those three contests all resulted in an overall majority, including in two instances a relatively safe one.
Historical precedent apparently suggests that the Conservative lead should have been sufficient to give the party an overall majority.
What about variable constituency sizes?
One consequence of the prime minister’s decision to secure a Commons vote for an early election is that the contest had to be fought on the same constituency boundaries as in 2015 and not on the new boundaries the various parliamentary boundary commissions were in the midst of preparing in readiness for an election in 2020.
The resulting inequality in the sizes of constituencies was certainly a disadvantage for the Conservatives. The average electorate in constituencies they won at this election was 74,451, whereas in seats won by Labour it was 70,529. The difference of some 3,920 people was around 520 bigger than it had been two years previously.
The gap may have been increased somewhat by the government’s decision in 2015 to speed up the introduction of individual electoral registration, which resulted in particularly sharp drops in registration in some typically Labour-held constituencies with large numbers of students. But the gap was then narrowed somewhat by the applications to be added to the register many (and especially younger) voters made after its initial compilation in December 2016. These added 2,300 names on average to the register in constituencies that Labour won, compared with just 1,600 on average in seats won by the Conservatives.
Did voter turnout make a difference?
However, inequalities in the registered electorate are not the only consideration that we have to bear in mind in considering the sizes of constituencies. Bias might also arise if turnout is lower in seats held by one party than it is in those won by its opponents. Indeed, turnout was on average some four points lower on average in seats won by Labour at this election (66.5 per cent) than it was in those won by the Conservatives (70.7 per cent).
That said, this was a noticeably smaller gap than in 2015, for turnout increased on average by 3.8 points in seats Labour won, but by only 2.0 points in those won by the Conservatives. As a result, at 5,675 votes, the difference between Conservative and Labour-held seats in terms of the total number of votes cast was actually smaller at this election than it had been in the same two sets of seats two years previously (6,541).
To this we need to add one other consideration. The relative success of the Conservatives in seats with a relatively high Leave vote meant that the increase in the party’s vote was often greater in more working-class seats outside of London and the south of England, whose populations have grown less rapidly and thus tend to have lower than average electorates.
For example, Conservative support increased on average by as much as 7.3 points in seats in which fewer than 72,000 people were registered to vote, compared with just 4.3 points where more than 77,000 names appeared on the register. Similarly, while the Conservative vote increased on average by 9.7 points where turnout was less than 65 per cent, it increased by just 3.2 points where turnout was above 71 per cent. As a result, there was a noticeable reduction in the extent to which the Conservative vote was concentrated in constituencies where more people turned out to vote.
So are the Conservatives at a disadvantage from the electoral system?
In short, while inequalities in the sizes of constituencies were disadvantageous to the Conservatives at this election, the pattern of the party’s performance, together with changes in the pattern of turnout, reduced this disadvantage compared with 2015.
Such inequalities are not, though, the only potential reason why the single member plurality electoral system might treat one of the two largest parties more favourably than the other; a party can also be advantaged if its vote is more efficiently distributed, that is, if it wins seats by small majorities rather than large ones.
The Conservatives profited from this feature at this election, as indeed they had done in 2015, primarily because Labour won more seats by large majorities. The Labour Party was ahead of the Conservatives by more than 40 points in 27 per cent of seats that it won, while the Conservative Party was that far ahead of Labour in just 12 per cent of the constituencies that it won.
In short, whatever disadvantage the Conservatives suffered as a result of inequalities in the sizes of constituencies tended to be compensated by them having a more efficiently distributed vote.
John Curtice, Strathclyde University, Stephen Fisher, Trinity College, Oxford, and Robert Ford and Patrick English, University of Manchester, are authors of The Results Analysed, in ‘The British General Election of 2017’, edited by Philip Cowley and Dennis Kavanagh, from which this article is extracted

