
 Yahoo News
 Does Chicago Rivet & Machine Co.'s (NYSEMKT:CVR) P/E Ratio Signal A Buying Opportunity?

Unfortunately for some shareholders, the Chicago Rivet & Machine (NYSEMKT:CVR) share price has dived in the last thirty days. Even longer term holders have taken a real hit with the stock declining 17% in the last year.
All else being equal, a sharp share price increase should make a stock less attractive to potential investors. While the market sentiment towards a stock is very changeable, in the long run, the share price will tend to move in the same direction as earnings per share. The implication here is that deep value investors might steer clear when expectations of a company are too high. One way to gauge market expectations of a stock is to look at its Price to Earnings Ratio (PE Ratio). A high P/E implies that investors have high expectations of what a company can achieve compared to a company with a low P/E ratio.
Check out our latest analysis for Chicago Rivet & Machine
Does Chicago Rivet & Machine Have A Relatively High Or Low P/E For Its Industry?
Chicago Rivet & Machine's P/E is 20.77. The image below shows that Chicago Rivet & Machine has a P/E ratio that is roughly in line with the machinery industry average (20.4).
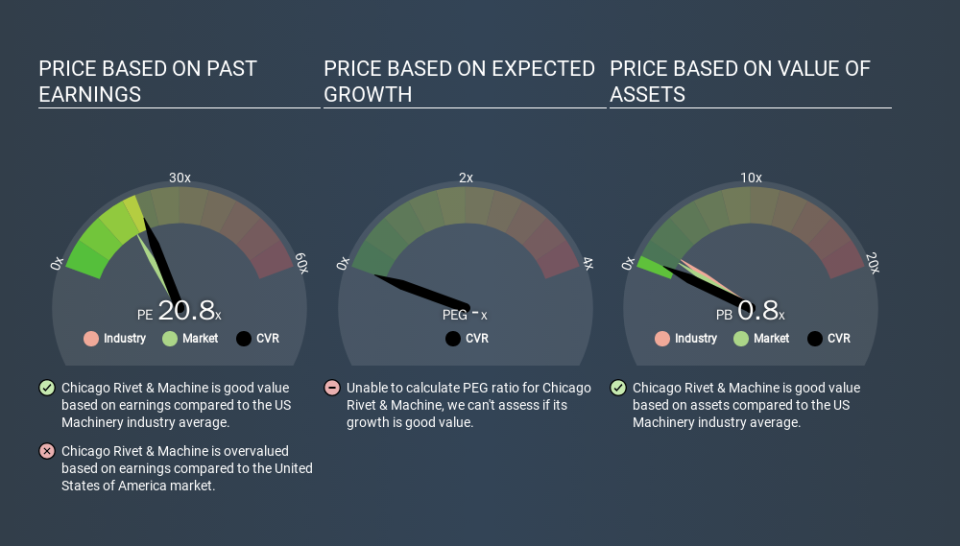
Its P/E ratio suggests that Chicago Rivet & Machine shareholders think that in the future it will perform about the same as other companies in its industry classification. If the company has better than average prospects, then the market might be underestimating it. Further research into factors such as insider buying and selling, could help you form your own view on whether that is likely.
How Growth Rates Impact P/E Ratios
When earnings fall, the 'E' decreases, over time. That means even if the current P/E is low, it will increase over time if the share price stays flat. So while a stock may look cheap based on past earnings, it could be expensive based on future earnings.
Chicago Rivet & Machine saw earnings per share decrease by 54% last year. And EPS is down 13% a year, over the last 5 years. This could justify a pessimistic P/E.
Don't Forget: The P/E Does Not Account For Debt or Bank Deposits
Don't forget that the P/E ratio considers market capitalization. Thus, the metric does not reflect cash or debt held by the company. The exact same company would hypothetically deserve a higher P/E ratio if it had a strong balance sheet, than if it had a weak one with lots of debt, because a cashed up company can spend on growth.
Such expenditure might be good or bad, in the long term, but the point here is that the balance sheet is not reflected by this ratio.
How Does Chicago Rivet & Machine's Debt Impact Its P/E Ratio?
With net cash of US$7.3m, Chicago Rivet & Machine has a very strong balance sheet, which may be important for its business. Having said that, at 31% of its market capitalization the cash hoard would contribute towards a higher P/E ratio.
The Bottom Line On Chicago Rivet & Machine's P/E Ratio
Chicago Rivet & Machine's P/E is 20.8 which is above average (17.1) in its market. The recent drop in earnings per share would make some investors cautious, but the healthy balance sheet means the company retains potential for future growth. If fails to eventuate, the current high P/E could prove to be temporary, as the share price falls. Given Chicago Rivet & Machine's P/E ratio has declined from 20.8 to 20.8 in the last month, we know for sure that the market is less confident about the business today, than it was back then. For those who prefer to invest with the flow of momentum, that might be a bad sign, but for a contrarian, it may signal opportunity.
Investors have an opportunity when market expectations about a stock are wrong. If the reality for a company is better than it expects, you can make money by buying and holding for the long term. Although we don't have analyst forecasts you could get a better understanding of its growth by checking out this more detailed historical graph of earnings, revenue and cash flow.
Of course, you might find a fantastic investment by looking at a few good candidates. So take a peek at this free list of companies with modest (or no) debt, trading on a P/E below 20.
If you spot an error that warrants correction, please contact the editor at editorial-team@simplywallst.com. This article by Simply Wall St is general in nature. It does not constitute a recommendation to buy or sell any stock, and does not take account of your objectives, or your financial situation. Simply Wall St has no position in the stocks mentioned.
We aim to bring you long-term focused research analysis driven by fundamental data. Note that our analysis may not factor in the latest price-sensitive company announcements or qualitative material. Thank you for reading.

