
 Yahoo News
 How Does Vivo Energy's (LON:VVO) P/E Compare To Its Industry, After The Share Price Drop?

Unfortunately for some shareholders, the Vivo Energy (LON:VVO) share price has dived 32% in the last thirty days. Indeed the recent decline has arguably caused some bitterness for shareholders who have held through the 47% drop over twelve months.
Assuming nothing else has changed, a lower share price makes a stock more attractive to potential buyers. In the long term, share prices tend to follow earnings per share, but in the short term prices bounce around in response to short term factors (which are not always obvious). So, on certain occasions, long term focussed investors try to take advantage of pessimistic expectations to buy shares at a better price. One way to gauge market expectations of a stock is to look at its Price to Earnings Ratio (PE Ratio). A high P/E ratio means that investors have a high expectation about future growth, while a low P/E ratio means they have low expectations about future growth.
Check out our latest analysis for Vivo Energy
How Does Vivo Energy's P/E Ratio Compare To Its Peers?
Vivo Energy's P/E is 7.79. You can see in the image below that the average P/E (7.8) for companies in the specialty retail industry is roughly the same as Vivo Energy's P/E.
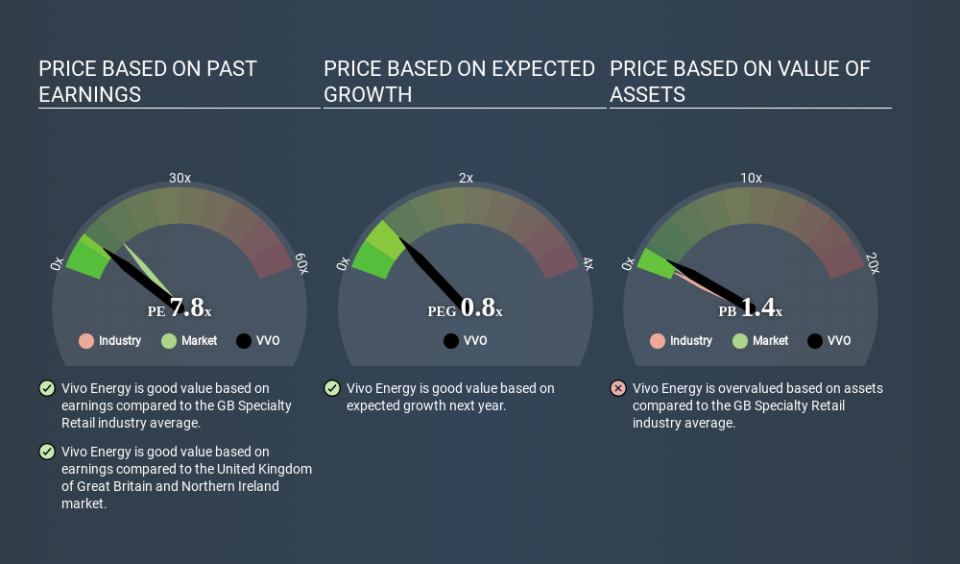
That indicates that the market expects Vivo Energy will perform roughly in line with other companies in its industry. So if Vivo Energy actually outperforms its peers going forward, that should be a positive for the share price. I would further inform my view by checking insider buying and selling., among other things.
How Growth Rates Impact P/E Ratios
If earnings fall then in the future the 'E' will be lower. Therefore, even if you pay a low multiple of earnings now, that multiple will become higher in the future. So while a stock may look cheap based on past earnings, it could be expensive based on future earnings.
Vivo Energy shrunk earnings per share by 3.5% last year. And over the longer term (5 years) earnings per share have decreased 66% annually. So you wouldn't expect a very high P/E.
A Limitation: P/E Ratios Ignore Debt and Cash In The Bank
The 'Price' in P/E reflects the market capitalization of the company. So it won't reflect the advantage of cash, or disadvantage of debt. Hypothetically, a company could reduce its future P/E ratio by spending its cash (or taking on debt) to achieve higher earnings.
Such expenditure might be good or bad, in the long term, but the point here is that the balance sheet is not reflected by this ratio.
Vivo Energy's Balance Sheet
Vivo Energy has net debt worth just 8.2% of its market capitalization. The market might award it a higher P/E ratio if it had net cash, but its unlikely this low level of net borrowing is having a big impact on the P/E multiple.
The Verdict On Vivo Energy's P/E Ratio
Vivo Energy's P/E is 7.8 which is below average (12.5) in the GB market. With only modest debt, it's likely the lack of EPS growth at least partially explains the pessimism implied by the P/E ratio. Given Vivo Energy's P/E ratio has declined from 11.5 to 7.8 in the last month, we know for sure that the market is more worried about the business today, than it was back then. For those who prefer to invest with the flow of momentum, that might be a bad sign, but for deep value investors this stock might justify some research.
Investors have an opportunity when market expectations about a stock are wrong. If the reality for a company is not as bad as the P/E ratio indicates, then the share price should increase as the market realizes this. So this free report on the analyst consensus forecasts could help you make a master move on this stock.
Of course, you might find a fantastic investment by looking at a few good candidates. So take a peek at this free list of companies with modest (or no) debt, trading on a P/E below 20.
If you spot an error that warrants correction, please contact the editor at editorial-team@simplywallst.com. This article by Simply Wall St is general in nature. It does not constitute a recommendation to buy or sell any stock, and does not take account of your objectives, or your financial situation. Simply Wall St has no position in the stocks mentioned.
We aim to bring you long-term focused research analysis driven by fundamental data. Note that our analysis may not factor in the latest price-sensitive company announcements or qualitative material. Thank you for reading.

